


Voya Corporate Pension Intelligence Update 3Q26

LDI Solutions Strategist

With funded status near 20-year highs, a new question arises: How should assets be invested once a plan has a meaningful surplus?
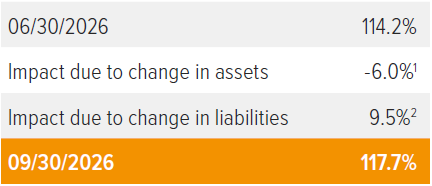
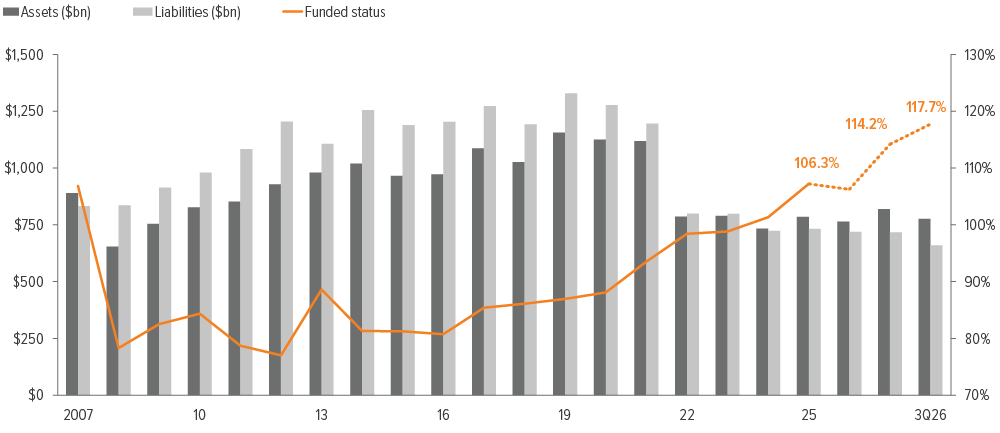
1 Growth assets generated a negative return during the quarter, reflecting weaker equity market performance. Hedging assets decreased due to the increase in discount rates with corresponding decline in long-duration fixed income values. After reflecting investment performance and benefit payments, total plan assets decreased approximately 4.0% during the quarter.
2 Plan liabilities decreased approximately 7.9% during the quarter, primarily due to the 85 bp increase in discount rates, assuming a plan duration of 11 years and reflecting service accruals and benefit payments.
As of 09/30/26. Source: S&P, FYE 2025 company reports, Voya IM calculations and 2026 estimates assume a 50% / 50% split in growth and hedging assets.
In the Spotlight: The next evolution of LDI
For nearly two decades, the corporate pension story has largely moved in one direction. As funded status improved, sponsors increased hedge ratios and shifted assets toward fixed income. But with funded status at historically strong levels, more plans are confronting a different question: How should assets be invested once the plan has a meaningful surplus?
Our 2026 Corporate Pension Intelligence Report suggests that fixed-income allocations generally increase as plans approach full funding, but that relationship begins to bend among the most highly overfunded plans. In the 2019-2025 data, that inflection appears around 129% funded, while the number of plans above 130% funded increased from four in 2021 to 18 in 2025.
Reaching this degree of overfunding does not necessarily mean abandoning LDI or simply rotating back into equities. At today’s higher starting yields, contractual income can do more of the work toward supporting a plan’s expected return on assets, potentially reducing reliance on asset appreciation alone. This creates an opportunity to think more broadly about the composition of the LDI portfolio and to diversify sources of income and cash flow, including through investment grade (IG) private credit and commercial mortgage loans (CMLs).
For mature plans in particular, these assets can be considered not simply through the lens of illiquidity, but also through cash flow certainty. IG private credit can provide long-dated contractual cash flows while adding potential incremental spread, lower losses, and non-coupon income relative to comparable public corporate bonds. Plus, as the IG corporate bond market becomes increasingly concentrated, private fixed income can provide important diversification at the borrower, collateral, and structural levels.
CMLs can complement that diversified exposure at shorter maturities. For example, shorter-duration bridge loans can provide scheduled principal repayment at horizons that may align with near- and intermediate term benefit payments. Together, IG private credit and CMLs illustrate how less-liquid assets can potentially provide both diversification and greater cash flow certainty within an LDI framework.
LDI 3.0 may ultimately be a diversification story. The objective shifts from funded status to preserving the discipline of liability-aware investing while broadening the sources of income, spread and contractual cash flows available to meet benefit payments and long-term return objectives.
Learn more: LDI in Action: Enhancing Yield without Sacrificing the Hedge
Notes on the third quarter of 2026
An 85 bp increase in the discount rate significantly reduced liabilities, driving further improvement in funded status despite slightly negative pension asset performance. Growth asset performance was modestly negative, and combined with declines in hedging assets associated with higher interest rates, total plan assets decreased approximately 4% during the quarter. However, liabilities declined by an even greater amount, resulting in an improvement in funded status. We estimate the funded status of extant pension plans in the S&P 500 improved during Q3 2026, rising from 114.2% to 117.7%, one of the highest levels observed since the global financial crisis. We assume a 50/50 split between growth assets and hedging assets, which is the average allocation for plans in the S&P 500.
The sharp increase in underlying Treasury yields, rather than spread widening, was the primary driver of higher pension discount rates. Resilient economic activity, elevated inflation and continued strength in the labor market contributed to a repricing of the monetary policy outlook, culminating in the Federal Reserve’s 25 bp rate hike in September. The Treasury curve bear-flattened during Q3 2026 as yields moved meaningfully higher across maturities, with intermediate yields rising somewhat more than the long end. The 10-year Treasury yield ended the quarter 85 bp higher, compared with a 73 bp increase in the 30-year yield. The FTSE AA discount rate increased to 6.35% from 5.49%, contributing significantly to lower pension liabilities during the quarter.
Corporate credit conditions remained relatively stable during Q3 2026, although spreads widened modestly across long-duration markets. Long Corporate OAS increased to 96 bps from 91 bps, while Long Gov/Credit OAS increased to 44 bps from 42 bps.
Equity performance was mixed across regions and market capitalizations, with our representative equity portfolio returning approximately -1% as gains in the S&P 500 and developed international equities offset by weakness in small-cap U.S. equities, while emerging market equities were broadly flat. Our representative equity portfolio had a slightly negative return for the quarter. For this purpose, we use a mix of S&P 500 (45%), Russell 2000 (25%), MSCI EAFE (20%), and MSCI EM (10%), reflecting the breadth of equity holdings in most plans.
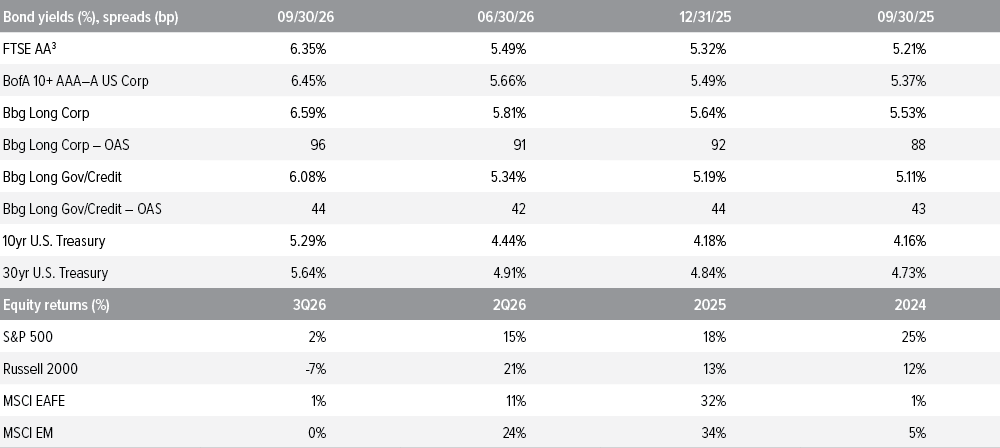
Source: FTSE, Barclays Live, ICE Index Platform, S&P, MSCI, Russell. See back page for index definitions.
3 Based on FTSE’s “short” duration plan, approximately 10.9 years.
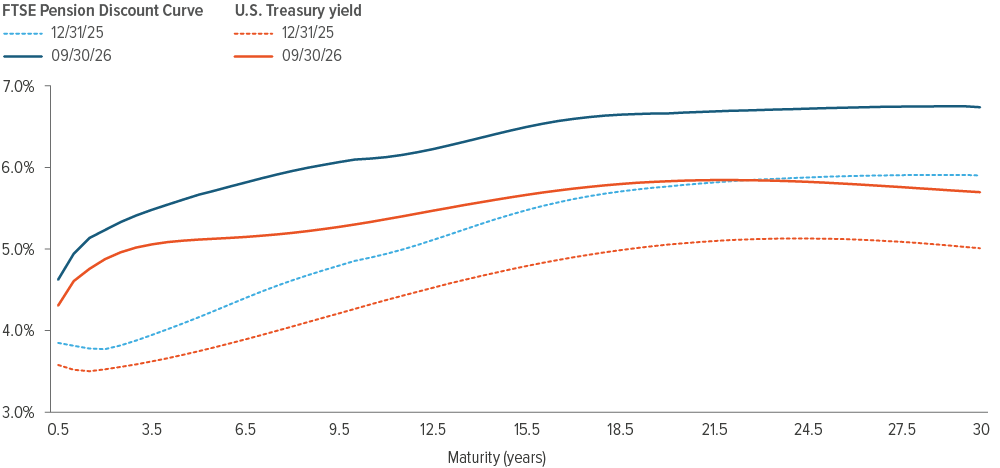
Source: ICE Index Platform, FTSE pension discount curve.
- The US Treasury spot rate curve is flatter than the FTSE pension discount curve as of 09/30/26.
- For the 15-year tenor, the U.S. Treasury spot rate is higher as of 09/30/26 vs. 12/31/25.
- Similarly, for the 15-year tenor, the Aa-rated corporate bond spot rate is higher as of 09/30/26 vs. 12/31/25.
A note about risk: Examples of LDI (liability-driven investing) performance included in this material are for illustrative purposes only. Liability valuations can increase due to falling interest rates or credit spreads, among other things, as the present value of future obligations increases with falling rates and falling spreads. Liabilities can also increase due to actual demographic experience differing from expected future experience assumed by the plan’s actuary. Diversification neither assures nor guarantees better absolute performance or relative performance versus a pension plan’s liabilities. In addition, investing in alternative investment products such as derivatives can increase the risk and volatility in an investment portfolio. Because investing involves risk to principal, positive results and the achievement of an investor’s goals are not guaranteed. There are no assurances that any investment strategy will be profitable on an absolute basis or relative to the pension plan’s liabilities. Information contained herein should not be construed as comprehensive investment advice. For comprehensive investment advice, please consult a financial professional.