


Voya Corporate Pension Intelligence Update 2Q26

LDI Solutions Strategist

A new wave of ERISA-friendly commercial mortgage loan investment vehicles are helping to streamline sponsors’ ability to broaden their fixed income toolkit. Here’s why that’s interesting right now.
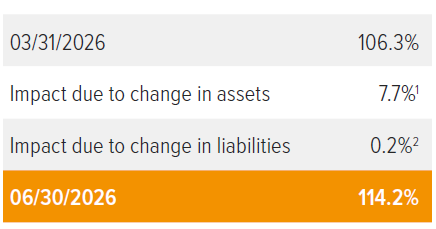
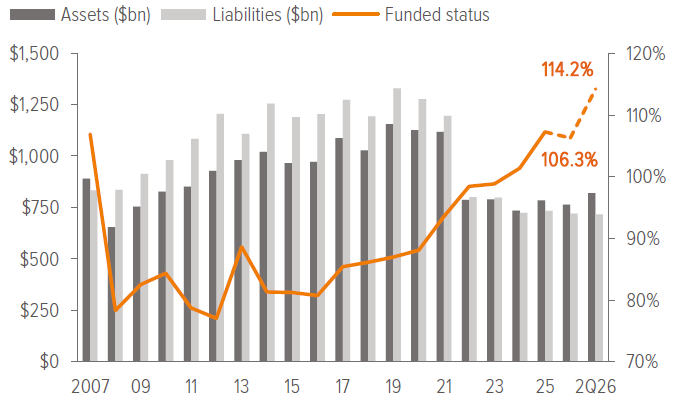
1 Growth asset return during the quarter was approximately 17%, reflecting mixed equity market performance. Hedging assets, which match liability duration by design, were relatively unchanged as the discount rate increased by 1 bp. After reflecting benefit payments, total net asset return was approximately 9%.
2 Liabilities were essentially unchanged during the quarter due to the 1 bp decrease in discount rates, assuming a plan duration of 11 years and accounting for service accruals and benefit payments.
As of 06/30/26. Source: S&P, FYE 2024 company reports, Voya IM calculations and 2026 estimates. Assumes a 50% / 50% split in growth and hedging assets.
In the spotlight: The real asset rotation
A new wave of ERISA-friendly commercial mortgage loan (CML) investment vehicles are helping to streamline sponsors’ ability to broaden their fixed income toolkit beyond traditional public corporate bonds. Here’s why that is interesting right now.
For much of the last several years, commercial real estate has been defined by challenges. Rising interest rates, reduced transaction activity, concerns surrounding office demand, and a wave of new supply created headwinds across large portions of the market. As a result, many investors moved to the sidelines, favoring more traditional fixed income sectors while waiting for signs of commercial real estate’s recovery. That recovery seems to have begun in the second half of last year.
While concerns remain around some subsectors and markets, commercial real estate fundamentals are broadly moving in a more constructive direction. Commercial property transaction volumes recovered meaningfully during the second half of 2025, mortgage originations strengthened, and leasing activity improved across many property sectors. At the same time, construction activity has slowed sharply from post pandemic peaks due to higher rates, helping supply and demand move toward a healthier balance. Even office markets, while still facing challenges, have shown signs of stabilization in a number of major metropolitan areas—particularly for newer, higher quality properties.
For corporate pension plans, the significance extends beyond improving real estate fundamentals. CMLs are one of the few credit sectors whose cycle appears to be strengthening while many traditional spread sectors contend with tight valuations and compressed spreads.
Unlike corporate bonds, whose performance is driven primarily by corporate earnings and economic growth, CML performance is tied to property cash flows, local market dynamics and real asset fundamentals. Historically, this has resulted in relatively low correlations to many traditional fixed income and risk asset classes.
That distinction may become increasingly important as sponsors seek greater diversification within large fixed income allocations. In addition, as plans age and liability durations decline, sponsors are increasingly evaluating fixed income sectors through both a diversification and cash flow matching lens. For mature plans, shorter-duration bridge CMLs may mature at time horizons that align well with expected benefit payment obligations, creating a natural source of liquidity as benefits come due.
Historically, commercial mortgage loans have combined attractive current income with comparatively low volatility, producing compelling risk-adjusted returns relative to many traditional fixed income sectors. Voya’s long-term analysis show that's CMLs exhibit one of the strongest Sharpe ratios among the major asset classes and credit sectors evaluated, reflecting a combination of income generation, diversification benefits and relatively stable performance over time.
For a more detailed discussion of the state of the CML market now, see our recently published paper, Commercial Mortgage Loans: Back to Business.
Notes on the second quarter of 2026
A modest 1 bp decline in the discount rate resulted in pension liabilities essentially unchanged during the quarter. Asset performance was exceptionally strong, with our representative equity portfolio returning 17%, benefiting from broad-based gains across U.S. and international equity markets. Combined with hedging assets mostly unchanged by design, total plan assets increased approximately 9% during the quarter. As a result, we estimate the funded status of extant pension plans in the S&P 500 improved significantly during Q2 2026, rising from 106.3% to 114.2%, reaching one of the highest levels observed since the global financial crisis. We assume a 50/50 split between growth assets and hedging assets, which is the average allocation for plans in the S&P 500.
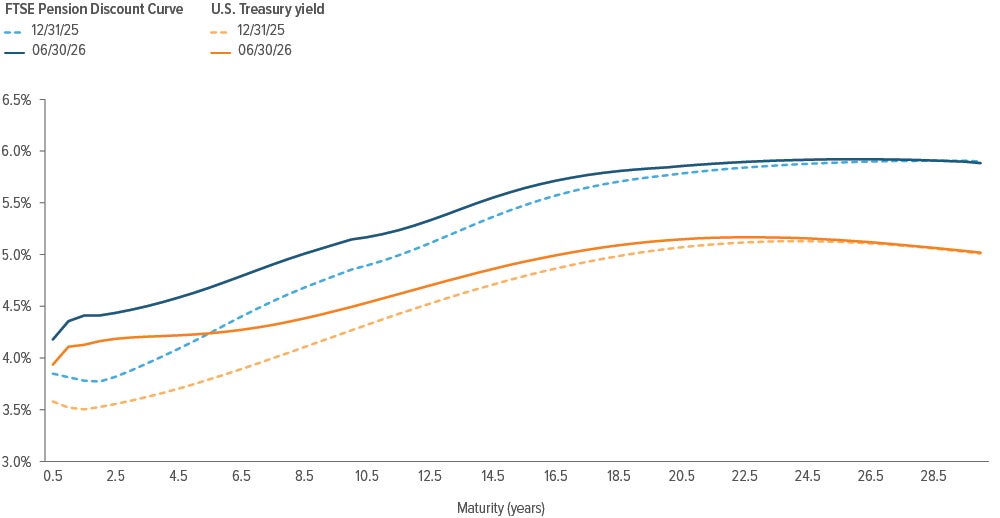
The Treasury curve bear-flattened during Q2 2026 as longer-dated Treasury yields remained relatively stable while shorter maturity rates moved higher. Economic data remained resilient throughout the quarter, with continued strength in labor markets and broader economic activity reducing expectations for near-term Federal Reserve rate cuts. As investors reassessed the timing and pace of future monetary policy easing, shorter-dated Treasury yields moved higher while long-term rates remained largely unchanged. At the same time, credit spreads tightened and risk assets generated strong returns, providing a meaningful tailwind to pension asset performance. Stable long-term discount rates helped limit liability growth, contributing to improved funded status for many plans.
Corporate credit conditions remained supportive during Q2 2026 as credit spreads tightened across long-duration markets. Long Corporate OAS narrowed to 91 bps from 101 bps, while Long Gov/ Credit OAS narrowed to 42 bps from 47 bps. Strong demand for investment-grade credit, stable corporate fundamentals, and continued investor appetite for yield supported spread compression throughout the quarter. From a liability perspective, the FTSE AA discount rate edged lower, to 5.49% from 5.50%.
Our representative equity portfolio had a strongly positive return for the quarter. For this purpose, we use a mix of S&P 500 (45%), Russell 2000 (25%), MSCI EAFE (20%), and MSCI EM (10%), reflecting the breadth of equity holdings in most plans. Performance was in the double digits across all regions and market capitalizations. Highest returns came from emerging markets and small cap U.S. equities, while the S&P 500 and developed international equities also produced robust gains. The favorable equity environment was a primary driver of the significant improvement in funded status during the quarter.
Source: ICE Index Platform, FTSE pension discount curve.
- The US Treasury spot rate curve is flatter than the FTSE pension discount curve as of 6/30/2026.
- For the 15-year tenor, the U.S. Treasury spot rate is higher as of 6/30/2026 vs. 12/31/2025.
- Similarly, for the 15- year tenor, the Aa-rated corporate bond spot rate is higher as of 6/30/2026 vs. 12/31/2025.
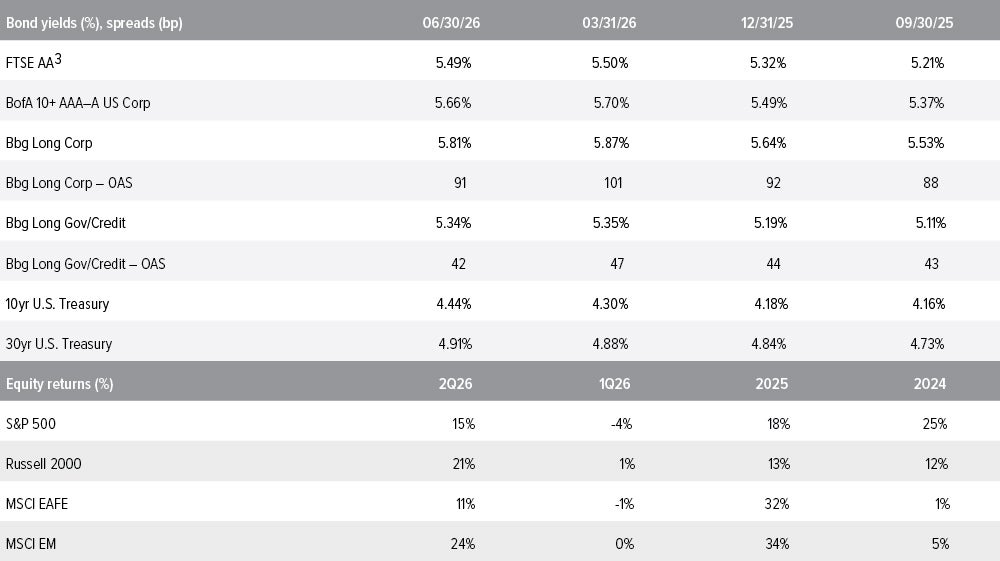
Source: FTSE, Barclays Live, ICE Index Platform, S&P, MSCI, Russell. See back page for index definitions.
3 Based on FTSE’s “short” duration plan, approximately 10.9 years.
A note about risk: Examples of LDI (liability-driven investing) performance included in this material are for illustrative purposes only. Liability valuations can increase due to falling interest rates or credit spreads, among other things, as the present value of future obligations increases with falling rates and falling spreads. Liabilities can also increase due to actual demographic experience differing from expected future experience assumed by the plan’s actuary. Diversification neither assures nor guarantees better absolute performance or relative performance versus a pension plan’s liabilities. In addition, investing in alternative investment products such as derivatives can increase the risk and volatility in an investment portfolio. Because investing involves risk to principal, positive results and the achievement of an investor’s goals are not guaranteed. There are no assurances that any investment strategy will be profitable on an absolute basis or relative to the pension plan’s liabilities. Information contained herein should not be construed as comprehensive investment advice. For comprehensive investment advice, please consult a financial professional.