Voya Corporate Pension Intelligence Update 1Q26

LDI Solutions Strategist

As sponsors confront volatile oil prices and geopolitical risk, here’s a look at what does (and doesn’t) work.
As of 03/31/26. Source: S&P, FYE 2024 company reports, Voya IM calculations and 2025-2026 estimates. Assumes a 50% / 50% split in growth and hedging assets
In the spotlight: Sword of Damocles
In the classic parable, the Sword of Damocles represents the burden of decision‑making under uncertainty, where those in positions of power bear disproportionate downside risk—the titular sword hanging over their heads, suspended by a single hair that can snap at any time.
With high, volatile oil prices and rising geopolitical risk tied to Iran but equity volatility still relatively subdued (a VIX below 30), sponsors may feel that they are in a “Sword of Damocles” moment. Risks are clearly rising but price action remains deceptively calm, leaving investors aware that something could break—but uncertain what or when.
Energy has become the key swing variable for 2026. Sustained higher oil prices raise the probability of hotter inflation prints over the course of the year, complicating the path for monetary policy just as confidence in a soft landing narrative fades. In that context, the inflation surge of 2022 and the macro debates that followed now feel almost quaint compared to today’s environment, where geopolitical escalation alone could meaningfully reignite inflation pressures or unwind just as quickly if tensions ease.
Interest rates reflect this uncertainty. The Treasury curve flattened sharply into the end of March, with the two year yield rising from roughly 3.4% at the start of the month to just shy of 4% before retreating.
It is tempting to interpret this as a signal to park assets in short duration and wait for clarity. For corporate defined benefit plans, however, that instinct can be misleading. Most plan liabilities extend into the intermediate and long parts of the curve so maintaining long duration exposure is less a view on rates than an expression of liability alignment.
Moving to short duration does not reduce risk. It leaves liabilities unhedged and effectively assumes that rates will stay high long enough to re-enter the long end. If yields fall first, that missed hedge cannot be recovered.
The reality is that rates can still move meaningfully in either direction. Higher energy prices could push up inflation and yields across the curve, while a geopolitical resolution could quickly shift attention back to growth risks and pull yields lower. Anchoring a pension strategy to any single macro outcome shifts the focus from benefit security to market timing, introducing risks that are misaligned with a pension plan’s primary objective.
For sponsors that have already de-risked, the message is simple: Stay the course. Liability-aware de-risking is not about predicting where rates, oil, or volatility go next. It is about reducing sensitivity to uncertain outcomes across the curve. In an environment where visibility is low and headlines are loud, continuing to de-risk methodically remains the most prudent response.
Risk assets no longer offer the same intuitive comfort they once did, and for corporate pension plans the risk/reward simply does not make sense. Upside is limited: surplus is effectively trapped by excise taxes and regulatory constraints, and while recently there has been a spate of discussions about “uses of surplus,” those options are far easier to talk about than to execute in practice.
The downside, however, is very real. reversal in markets would increase underfunding risk and raise PBGC premiums, turning a tactical risk decision into a permanent cost.
At the margin, nearly every investment today embeds an implicit call on oil prices and geopolitical stability. For a corporate DB plan, taking those gambles offers little benefit and meaningful downside. When outcomes hinge on variables no one can forecast with confidence, discipline—not conviction—remains the best shield.
Notes on the first quarter of 2026
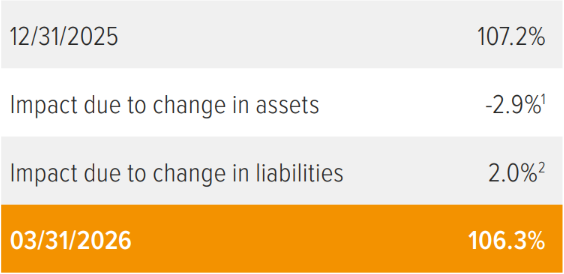
An increase in the discount rate of 18 bps resulted in liabilities declining slightly, down 0.6% during the quarter. Equity returns for a common mix of assets held by many sponsors was down 2%, creating a drag on funded status.
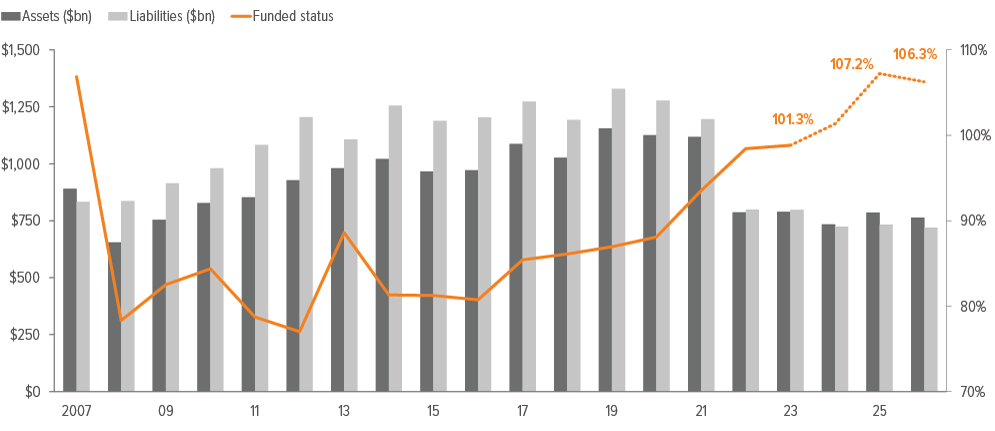
We estimate the funded status of extant pension plans in the S&P 500 declined modestly during the quarter but remains meaningfully higher on a year-over-year basis. We assume a 50/50 split between growth assets and hedging assets, which is the average allocation for plans in the S&P 500.
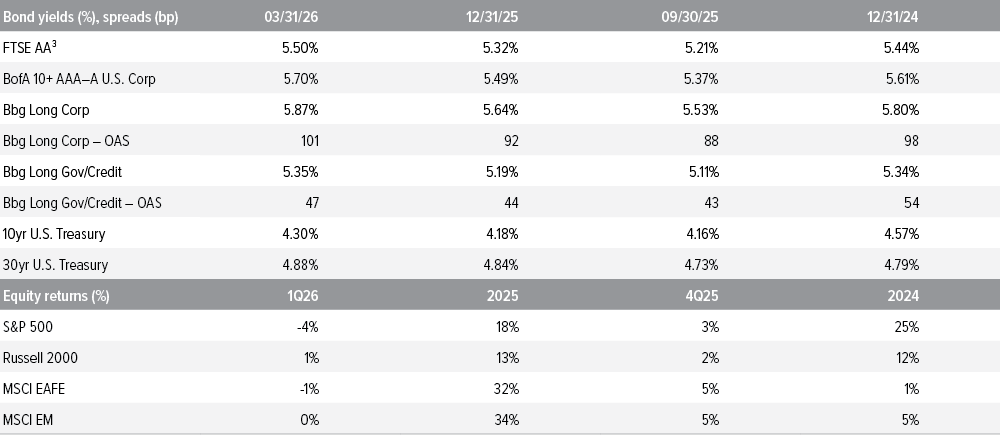
The Treasury curve bear-flattened during Q1 2026, as short‑ and intermediate‑maturity yields increased meaningfully, while long‑end rates moved higher to a far lesser extent. Market sentiment was shaped by resilient economic data, firmer inflation readings, and a reassessment of expectations for Federal Reserve policy easing, reinforced late in the quarter by elevated geopolitical tensions and rising energy prices. Front‑end yields responded most sharply to reduced expectations for near‑term accommodation, while longer‑term yields reflected lingering uncertainty around inflation persistence and term premia.
Corporate credit conditions softened modestly in Q1 2026, though spreads remain firm relative to prior-year levels. Demand for high-quality issuers persisted, though elevated rate volatility and higher Treasury yields led to some spread re‑pricing. Issuance was steady, and the market largely absorbed supply against a backdrop of stable fundamentals, though the tone was more balanced than the prior year. During the quarter, Long Corporate OAS widened to 101 bps from 92 bps, while Long Gov/Credit OAS edged higher to 47 bps from 44 bps. Despite this widening, both measures remain roughly in line with levels observed at the end of 2024. From a liability perspective, the FTSE AA discount rate increased 18 bps during the quarter to 5.50%, from 5.32%.
Our representative equity portfolio had a slightly negative return for the quarter. For this purpose, we use a mix of S&P 500 (45%), Russell 2000 (25%), MSCI EAFE (20%), and MSCI EM (10%), reflecting the breadth of equity holdings in most plans. Performance was mixed across regions and market capitalizations during the quarter, with weakness in large-cap U.S. equities partially offset by modestly positive small-cap performance and relatively flat returns in non‑U.S. markets.
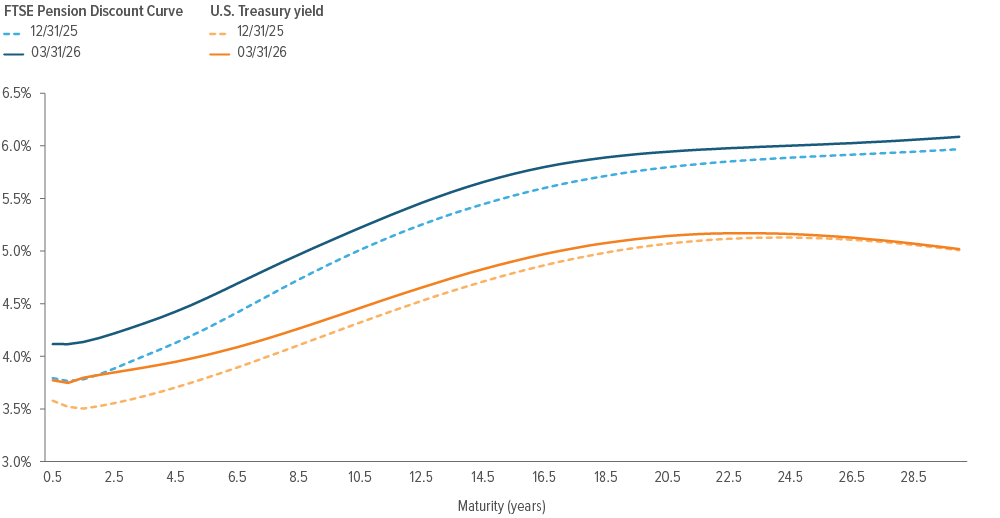
Source: ICE Index Platform, FTSE pension discount curve.
- The US Treasury spot rate curve is flatter than the FTSE pension discount curve as of 3/31/2026.
- For the 15-year tenor, the U.S. Treasury spot rate is higher as of 3/31/2026 vs. 12/31/2025.
- Similarly, for the 15-year tenor, the Aa-rated corporate bond spot rate is higher as of 3/31/2026 vs. 12/31/2025.
Source: FTSE, Barclays Live, ICE Index Platform, S&P, MSCI, Russell. See back page for index definitions.
A note about risk: Examples of LDI (liability-driven investing) performance included in this material are for illustrative purposes only. Liability valuations can increase due to falling interest rates or credit spreads, among other things, as the present value of future obligations increases with falling rates and falling spreads. Liabilities can also increase due to actual demographic experience differing from expected future experience assumed by the plan’s actuary. Diversification neither assures nor guarantees better absolute performance or relative performance versus a pension plan’s liabilities. In addition, investing in alternative investment products such as derivatives can increase the risk and volatility in an investment portfolio. Because investing involves risk to principal, positive results and the achievement of an investor’s goals are not guaranteed. There are no assurances that any investment strategy will be profitable on an absolute basis or relative to the pension plan’s liabilities. Information contained herein should not be construed as comprehensive investment advice. For comprehensive investment advice, please consult a financial professional.