LDI Quarterly Update: 2Q24

LDI Solutions Strategist

With many corporate pension plans now overfunded, sponsors are exploring ways to monetize those excess assets.
The following are historical insights based on market conditions at a point in time. Any forward-looking statements contained herein are based on information at the time. Current views, performance and portfolio information may differ materially from those expressed or implied in such statements. Voya IM makes no representation that past publications will be updated.
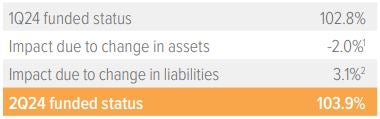
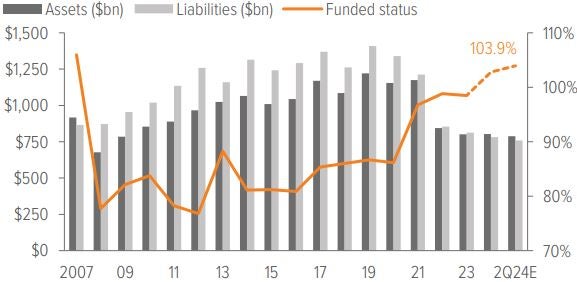
As of 06/30/24. Source: S&P, FYE 2023 company reports, Voya IM calculations, 2023 and 2024 estimates. 1) Growth assets based on equity return of 9%; hedging assets (which match liability duration) had a 7% decline year to date (similar to liabilities, by design), reflecting benefit payments. 2) Liabilities decreased 7% due to 53 bp increase in rates with plan duration of 11 years, accounting for service accruals and release from benefits payments.
In the spotlight: DB plans ponder surplus possibilitiesWith many corporate pension plans now overfunded, sponsors are exploring ways to monetize those excess assets. The simplest approach, plan termination, is unfortunately not a winner: Excess assets that revert to the employer are subject to a 50% excise tax, plus corporate tax. However, here are a few options for sponsors seeking to access these “stranded” assets: Reopen the pension plan. An easy use of surplus is to give back to participants by increasing benefits. IBM made headlines in 2023 doing just that. In an act perhaps more opportunistic than paternalistic, IBM reopened its DB plan, with the accrual structured as a “swap” for a DC contribution. Fund retiree medical benefit costs. Pension surplus may be used to pay benefit costs to a sponsor’s retiree medical plan, referred to as a Section 420 asset transfer. Traditionally, plans needed to be over 120% funded to allow the transfer, but the SECURE 2.0 Act of 2022 relaxed that funding hurdle to 110% (while adding a couple other requirements). With retiree medical plans becoming less common, this may be a viable option for only a subset of plan sponsors. Acquire a company with an underfunded pension plan. M&A transactions should certainly not be led by a desire to unlock a pension surplus, but it doesn’t hurt to have an overfunded plan to cover the costs and the underfunding of an acquired plan. Transfer all or a portion of the excess assets to a qualified replacement plan (QRP). During a plan termination, if at least 25% of the surplus is allocated to a QRP, the remaining surplus assets are subject to only a 20% excise tax rate rather than the standard 50% tax. A QRP can be an employer’s existing DC plan or a newly created plan. (Note, however, that IRS private letter rulings have prohibited the use of the surplus in lieu of DC elective contributions.) Various rules and restrictions around this process necessitate consultation with ERISA counsel to ensure viability. Increase benefits to participants in the terminating plan. In this scenario, some or all of the terminating plan’s surplus is used to increase benefits on a pro-rata basis to all participants (actives, in-pay and deferred vested participants). The benefit increases must have a present value of at least 20% of the reversion amount the employer would have received had it not increased benefits. Sponsors should review plan documents and consult with legal counsel before embarking on any of the above strategies. |
Notes on the first half and second quarter of 2024
- Funded status for corporate U.S. pension plans continues to approach pre-GFC levels. We estimate the funded status of extant pension plans in the S&P 500 improved to 103.9% at the midway point of 2024, up from 98.5% at YE2023 and 102.8% as of 1Q24. An increase in the discount rate reduced liabilities, while strong equity returns helped asset performance.
- The Treasury curve shifted upward, with the 10yr UST and 30yr UST yields both increasing by almost 50 bp YTD and 15 bp QoQ.
- Credit spreads remain slightly narrower than YE2023. The net result of rate and spread movements in the first half of 2024 was a 53 bp increase in the FTSE Pension Discount Rate for short-duration plans (23 bp QoQ). For a plan with a duration of 11 years, this translates to nearly a 5% decrease in liabilities (2.5% QoQ) due to changes in rates and spreads alone.
- Our representative equity portfolio had a total return of 9% YTD (2% QTD), further contributing to the improved funded position. For this purpose, we use a mix of S&P 500 (45%), Russell 2000 (25%), MSCI EAFE (20%) and MSCI EM (10%), reflecting the breadth of equity holdings in most plans.
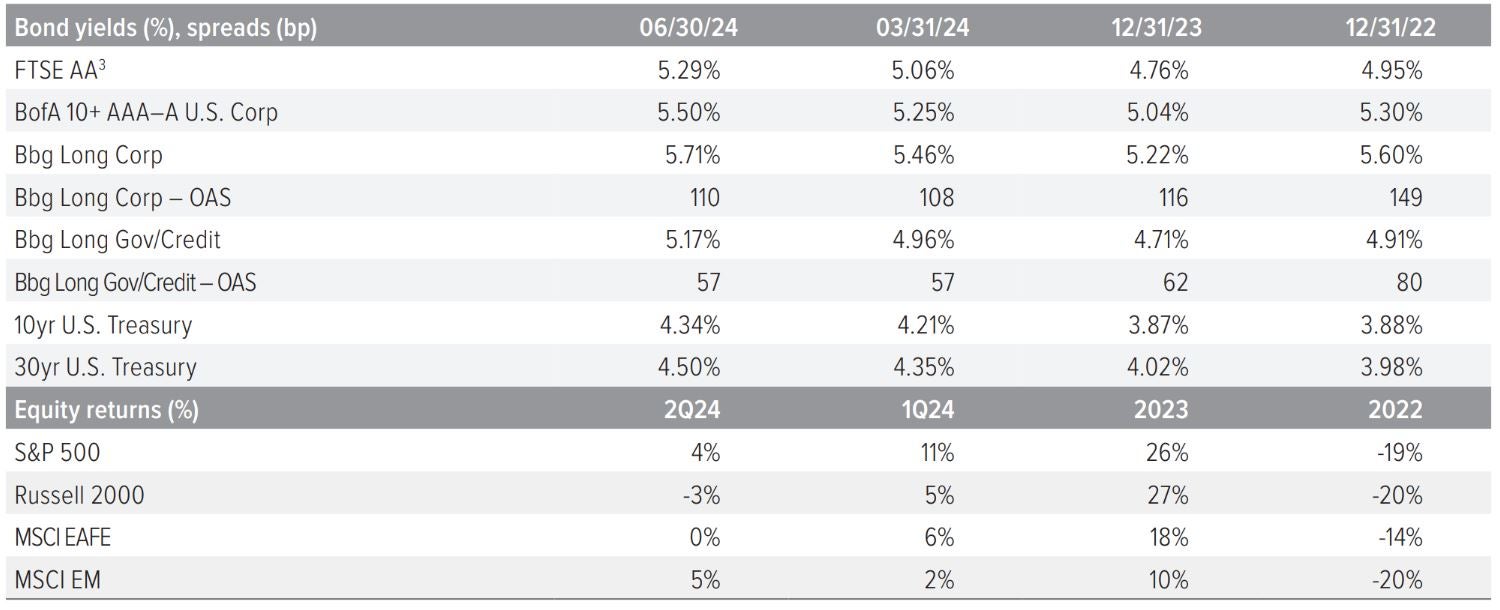
Source: FTSE, Barclays Live, ICE Index Platform, S&P, MSCI, Russell. See back page for index definitions. 3) Based on FTSE’s “short” duration plan, approximately 10.9 years.
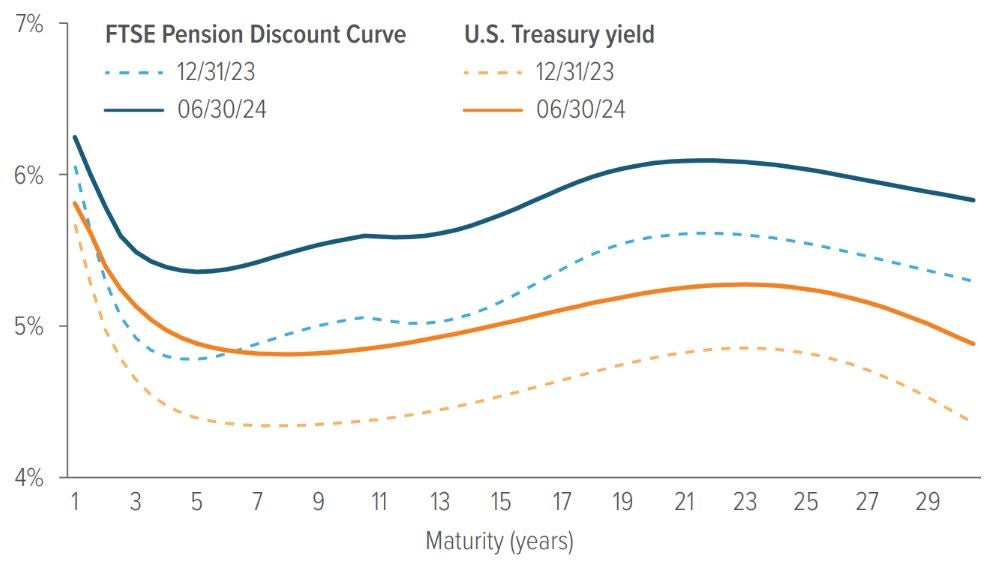
Source: ICE Index Platform, FTSE pension discount curve.
A note about riskExamples of LDI (liability-driven investing) performance included in this material are for illustrative purposes only. Liability valuations can increase due to falling interest rates or credit spreads, among other things, as the present value of future obligations increases with falling rates and falling spreads. Liabilities can also increase due to actual demographic experience differing from expected future experience assumed by the plan’s actuary. Diversification neither assures nor guarantees better absolute performance or relative performance versus a pension plan’s liabilities. In addition, investing in alternative investment products such as derivatives can increase the risk and volatility in an investment portfolio. Because investing involves risk to principal, positive results and the achievement of an investor’s goals are not guaranteed. There are no assurances that any investment strategy will be profitable on an absolute basis or relative to the pension plan’s liabilities. Information contained herein should not be construed as comprehensive investment advice. For comprehensive investment advice, please consult a financial professional. |