

For the Duration: The 7% Solution

Chief Investment Officer, Fixed Income

Hundreds of billions in investment grade bonds now yield more than 7%, and things might stay that way for a while. Here's why.
How much potential return does an investment need to earn its way into your portfolio? Everyone has their number. For a lot of the public pension sponsors I talk to, it’s 7% a year. I’d guess that 7% is also the number for a lot of individual investors, which is why it can be hard for return-seeking investors to commit to bonds when the equity market has been handing you 15- 20% a year recently. But the relative value calculus has changed radically over the past couple months, and not just because of increased equity volatility. About half of investment grade (IG) bonds are now yielding over 6%, $330 billion of market cap is over 7%—and given current debt supply/demand imbalances, things could stay this way for a while. Here’s why this is happening, and how you can take advantage of that.
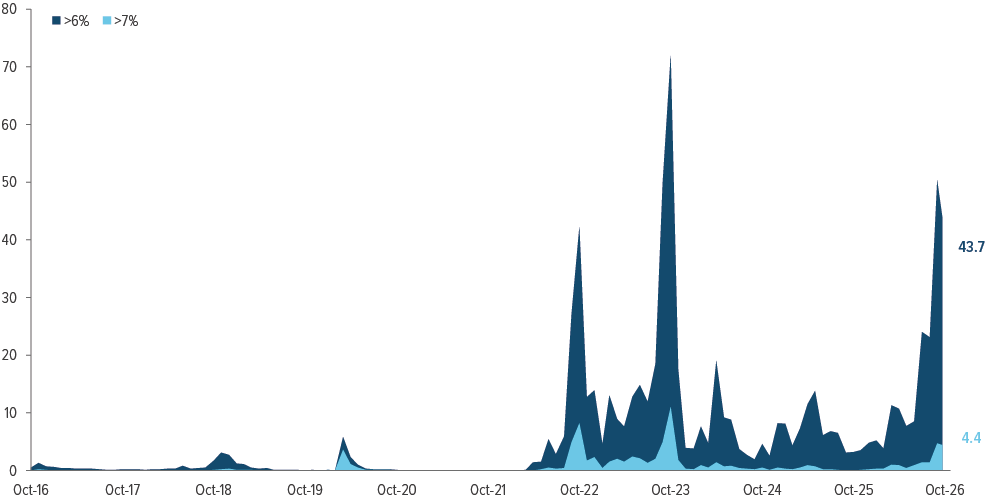
As of 10/21/26. Source: Barclays, Voya IM. Percentage in chart is by market cap; the equivalent numbers by issuer count are 46.4% and 3.2%.
Let me put this shift into perspective. Five years ago, high-risk bonds would barely get you half of 7%—when the high yield market troughed in July 2021, its yield to worst was 3.53%. Now there are more than $3 trillion in IG bonds trading over 6%, including hundreds of billions trading over 7%. Institutional investors can potentially add another 100-odd basis points on top of that in IG private placements. On a relative value basis, the yield on IG corporate bonds is outstripping the S&P’s earnings yield at a level last seen in June 2002 (Exhibit 2)
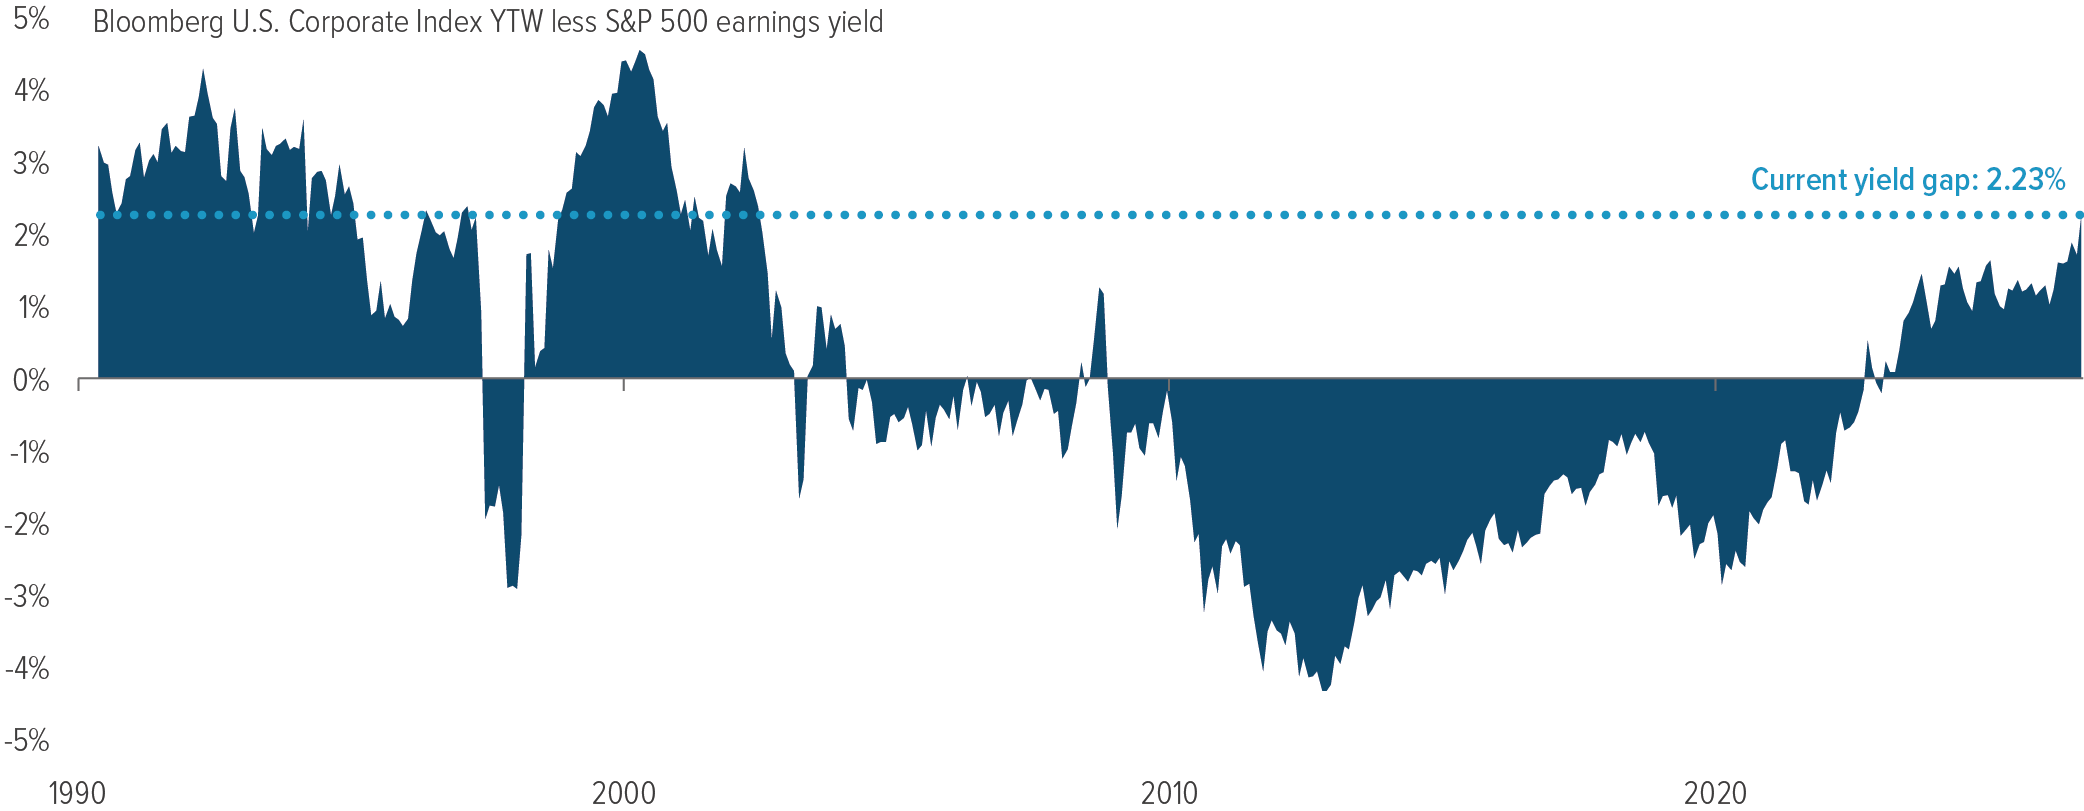
As of 10/21/26. Source: Voya IM.
What’s changed is the return of the high federal rate environment—with another 2-3 hikes currently priced in over the next 12 months, RIP to the mortgage market—combined with record amounts of IG bond supply coming down the pipe from highly price insensitive borrowers. These borrowers are, of course, hyperscalers ($1.4 trillion of capex forecast for 2027) and the U.S. Treasury (net new issuance of $2.1 trillion estimated for 2027). Have a look at what that’s doing to IG bond spreads by sector (Exhibit 3).
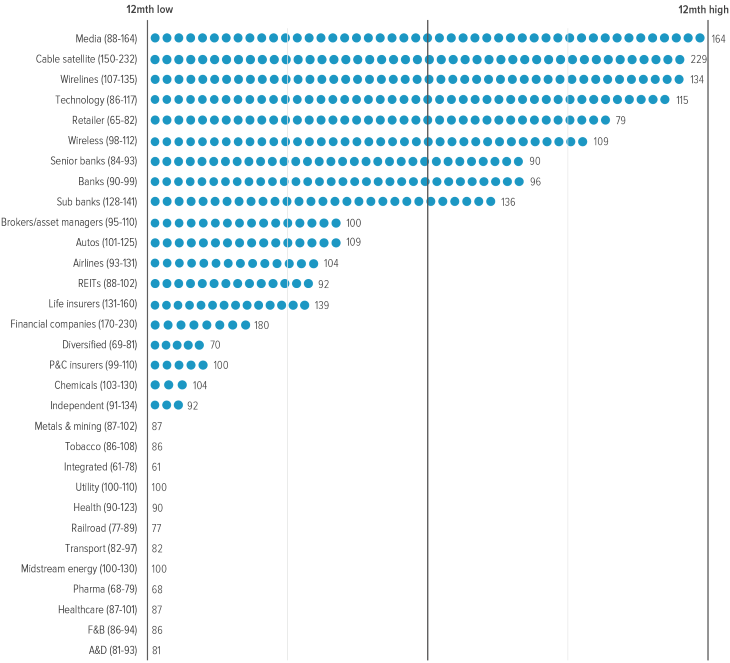
As of 10/21/26. Source: Barclays, Voya IM
That chart tells you a couple things. The first is that high-quality public corporations in the U.S. are broadly seen to be doing well and are expected to continue to do well over the next couple years. That’s why the majority of spreads are so tight. The second is that sectors which are expected to be raising a lot of money in 2027 are having to pay more to attract buyers. These sectors are mostly AI-related, though banks (traditionally heavy IG bond issuers) are also seeing spreads edge toward the higher end of their comparatively narrow range.
Make no mistake, high rates will start to bite some businesses—yes, even in the AI trade. There’s $40 billion in high-yield bonds maturing this quarter and another $253 billion 2027. Higher borrowing costs and more selective markets will mean that some lower-quality borrowers cannot refinance at a survivable price.
But, to get back to my friends running public pensions, this is no longer a market where you need to chase risk to hit your number. That potential 7% is waiting for you in the IG markets.
This is the first in a new monthly fixed income commentary series, For the Duration, from Voya IM’s CIO of Fixed Income.