


U.S. Investment Grade Credit: 2H26 Update

Head of U.S. Investment Grade Corporates

Co-Head of Client Portfolio Management, Fixed Income

Macro volatility and AI debt issuance headlines have been creating the noise; strong fundamentals and elevated rates have created the returns.
Executive summary
Volatility persists, but so do opportunities
U.S. investment grade (IG) corporate credit ended the first half of 2026 relatively unaffected by conflict in Iran, AI substitution risk headlines, and the massive (and ongoing) wave of AI-related debt issuance. Despite tight spreads, elevated rates are keeping risk asset returns attractive, and investor demand remains high. The second half looks like it will be more of the same, with copious issuance and tight spreads anchored by healthy fundamentals. Periods of spread volatility are likely to persist, and they can be used as opportunities to buy into high-quality issuers.
Key trends in 1H 2026
- Elevated rates and macro volatility failed to dent 1H’s returns, which stayed positive on healthy fundamentals and strong demand for quality credit.
- Utilities outperformed both financials and industrials, supported by strong demand tied to data center growth, lower new issuance, and the sector’s more defensive characteristics.
- Investment grade corporate bond issuance had a record-breaking first half, led by AI-related debt, which tended to subdue performance in the longer-dated and higher-quality end of the curve.
- Ratings momentum turned more positive in 2Q, highlighting the resilience of most corporate balance sheets.
2H 2026 outlook
- AI debt issuance is likely to moderate slightly in 2H but is still on course to end 2026 at nearly double 2025’s total, driven by record capex spending.
- Hyperscalers remain high-quality credits with healthy balance sheets and diversified revenue streams, despite the rapidly growing AI investment grade debt sector.
- 2H’s IG debt supply should be calmly digested by the market, as steady Asian interest and strong domestic insurance demand (driven by annuity sales) are keeping appetites sharp.
- Despite a broadly positive market environment, spread volatility is likely to continue, both on the macro side and surrounding the AI growth and disruption stories; this can potentially create attractive entry points to high-quality issuers.
Market review: 1H 2026
Markets entered 2026 with no shortage of volatility. After tariff and policy uncertainties dominated headlines in 2025, geopolitical risk moved to the forefront in late February with the start of conflict between the U.S. and Iran. The resulting closure of the Strait of Hormuz—a critical chokepoint for global maritime trade—pushed energy prices higher and contributed to renewed inflation pressure, complicating the monetary policy picture.
Although tensions eased after a series of ceasefire discussions, the conflict left a lasting imprint on fixed income markets. Higher energy costs and firmer inflation expectations pushed Treasury yields higher, particularly at the front end of the curve, as investors scaled back expectations for Federal Reserve rate cuts.
Despite elevated rates and macro volatility, markets have, through the halfway point of the year, rewarded investors for maintaining exposure to spread-oriented assets. Credit spreads have tightened since the start of the year on strong technicals and healthy fundamentals, while equities have rebounded on solid quarterly results, stronger AI-driven earnings, a robust capex cycle, and optimism that a conflict resolution could limit macro damage. As a result, fixed income risk assets have broadly delivered positive total and excess year-to-date returns (Exhibit 1).
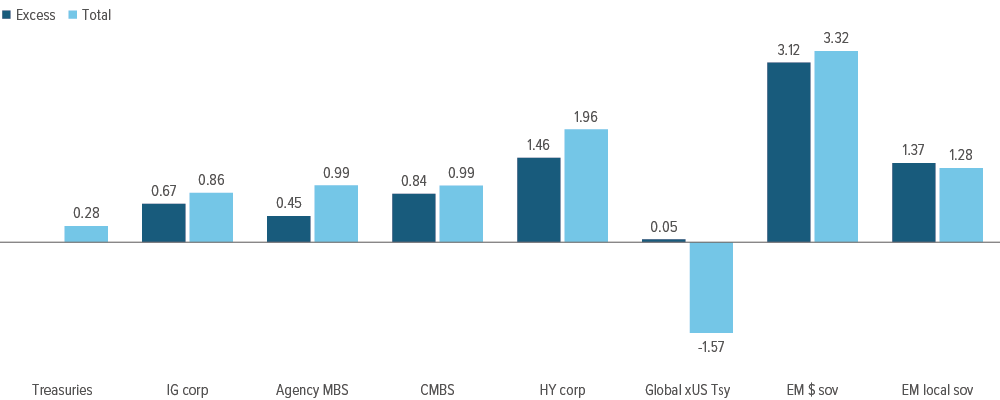
As of 06/30/26. Source: Bloomberg Index Services Limited, J.P. Morgan, Voya IM. Excess returns for the U.S. Agg, Treasuries, IG corp, agency MBS, CMBS, HY corp and global ex-U.S. Tsy are represented by the excess returns for the respective Bloomberg indexes. Excess return for EM $ sov is represented by the spread return for the J.P. Morgan EMBI Global Diversified Index. Excess return for EM local is represented by the total return for the J.P. Morgan GBI-EM Global Diversified Index (Tax-Adjusted Local Return) less the total return of the Bloomberg U.S. Treasury 3-7 Year Index. See endnotes for index definitions and additional disclosures.
Much like other risk assets, investment grade credit experienced a volatile start to 2026. IG spreads reached 93 bp in mid-March—their widest level since May 2025—before ending the quarter at 89 bp, 11 bp wider than where they began the year.
Early weakness was tied to growing concerns over AI-driven disruption in software and its implications for business development company (BDC) exposure, while the escalation of the Iran conflict and the resulting rise in oil prices intensified the risk-off tone later in the first quarter. A record wave of new issuance also weighed on market technicals by shifting the supply/demand balance less favorably.
Performance improved notably in the second quarter as geopolitical tensions eased and record corporate earnings drove renewed investor optimism. In April, IG spreads tightened 11 bp to 78 bp, retracing the first-quarter widening. They continued to trade near decade tights in May and June before ending the second quarter at 74 bp. The de-escalation in Iran, strong first-quarter earnings, and new highs in equities supported risk sentiment, allowing excess returns to offset the headwind from higher rates.
Across subsectors, performance was positive overall but uneven (Exhibit 2). Utilities outperformed both financials and industrials, supported by strong demand tied to data center growth as well as the sector’s more defensive characteristics.
Industrials and financials, by contrast, faced heavier supply pressure during the first half, with hyperscalers and banks accounting for a meaningful share of new issuance and driving net supply above prior-year levels. This supply dynamic also contributed to underperformance at the long end of the curve on an excess return basis, given the increase in longer-dated issuance. From a quality perspective, BBBs outperformed single- As, as first-half supply was largely concentrated among higher-quality issuers.
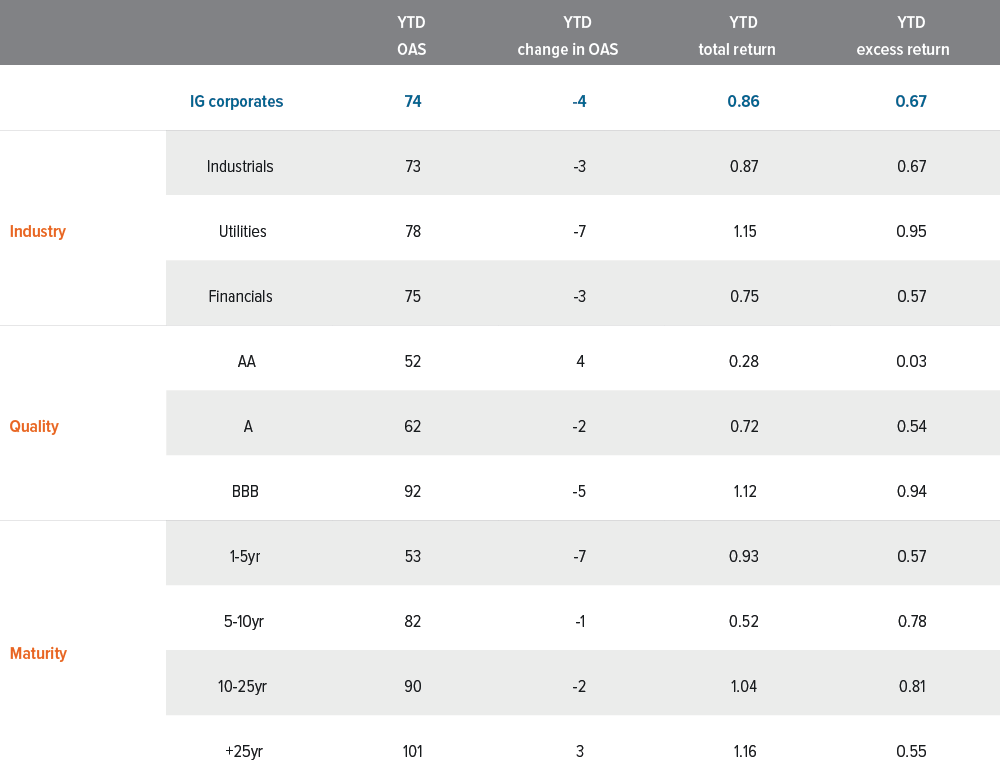
As of 06/30/26. Source: Bloomberg Index Services Ltd.
Market outlook: 2H 2026
Although 2026 has already delivered some surprises, many of our original outlook themes remain intact heading into the second half of the year. Issuance should remain exceptionally strong, but robust yield-driven demand will keep technicals in check. When combined with healthy fundamentals, the current setup can continue to anchor credit spreads, even near decade-tight levels. Furthermore, elevated starting yields provide a meaningful cushion if slower growth and policy uncertainty weigh on spreads.
Nonetheless, volatility is likely to remain elevated, particularly if rate swings persist or AI-related spending disappoints. While these risks could pressure spreads in the short term, they also create attractive opportunities for active managers to add risk.
AI-driven issuance to continue its record-breaking pace, but strong demand from yield-based buyers will provide a key counterbalance
Investment grade corporate bond issuance reached a record pace in the first half of 2026, with gross supply totaling $1.19 trillion. To put it into perspective, three of the first six months saw issuance exceed $200 billion. Financial supply remained sizeable, led by banks, which tend to have more front-loaded issuance. Non-financial issuance totaled $726 billion, or roughly 70% of aggregate supply, with technology companies contributing $210 billion alone.
While hyperscaler issuance remained a key driver, AI-related financing has broadened beyond the largest technology issuers. As a result, this wave of supply has reshaped the composition of the IG market, with more than 16% now tied to artificial intelligence (Exhibit 3).
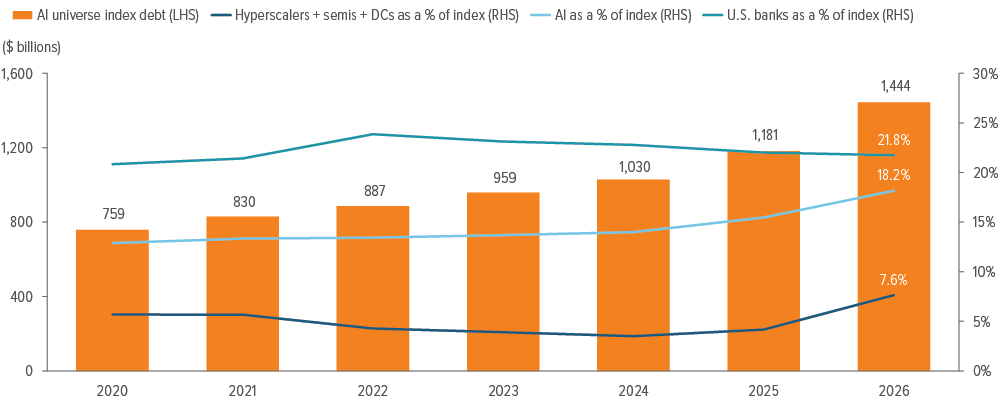
As of 06/30/26. Source: J.P. Morgan Research.
A note about risk
Bonds are subject to market, issuer, credit, prepayment, extension, and other risks, and their values may fluctuate. Indexes are unmanaged and not available for direct investment.