Voya Corporate Pension Intelligence Update: 4Q25

LDI Solutions Strategist

The past few years have been generous to corporate pension plans, but there are two imperatives as we move into 2026.
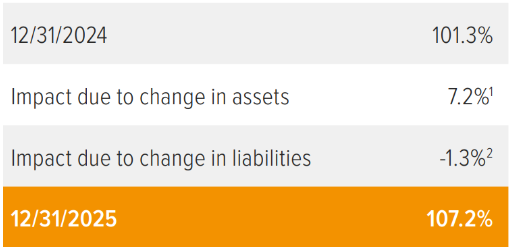
As of 12/31/25. Source: S&P, FYE 2024 company reports, Voya IM calculations and 2025 estimates. Assumes a 50% / 50% split in growth and hedging assets.
In the spotlight: Lock in and level up
The past few years have been generous to corporate pension plans—but in different ways:
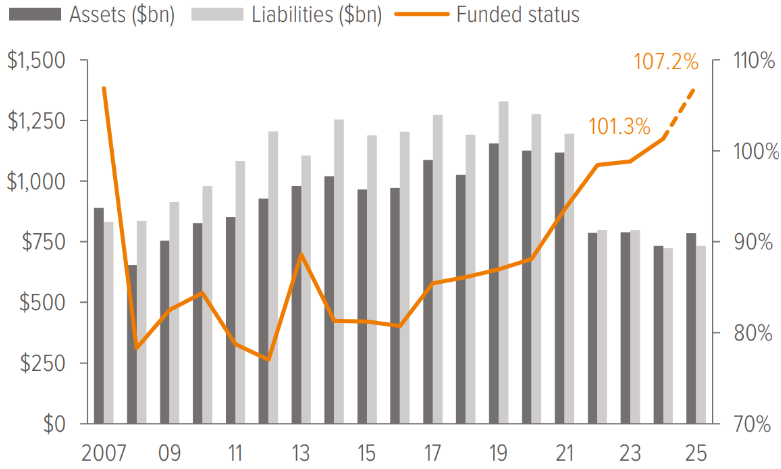
- 2022: Discount rates surged by over 200 bps, sharply reducing liabilities, while equities fell about 18%, making funded status gains primarily rate-driven.
- 2023: Discount rates declined by about 20 bps, increasing liabilities modestly, but equities rebounded strongly with returns of about 26%, driving funded status gains through asset growth.
- 2024: A powerful combination of higher discount rates (up around 70 bps) and strong equity returns (25%) delivered one of the most favorable environments in recent memory for sponsors to lock in gains.
- 2025: Equity strength took center stage, with the S&P 500 delivering 18% total return despite a volatile year, while liability-matching assets— designed to mimic liability moves—grew only 1–2% as the FTSE rate for short-duration plans declined a mere 12 bps.
Plans with higher equity allocations saw funded status surge, while those fully hedged experienced only modest improvement, by design. Sponsors with full hedges may feel a twinge of regret looking back at equity gains, but hindsight is 20/20. The real question is what to do now.
Two imperatives for 2026
1. Lock in: Surplus governance needs to move from ad hoc to systematic. Define clear triggers for de-risking, settlement, and surplus utilization. Make sure glide path steps are automatic when funded status crosses thresholds—because opportunities have come repeatedly, and governance determines whether they’re captured. Lastly, note the curve bull steepened significantly during the past year, with the front end lower by roughly 80 bps. This dynamic introduces a critical consideration for sponsors: Hedging strategies must go beyond aggregate duration matching to ensure key rate duration alignment. Otherwise, plans risk curve-twist exposure that can erode hedge precision even when aggregate duration appears matched.
2. Level up: Go beyond single-sector long government/credit. Multi-sector LDI sleeves— integrating investment-grade private credit (PCIG), commercial mortgage loans (CMLs), and select securitized credit—offer higher income and better tracking error control without sacrificing liability alignment. These diversifiers can help sponsors improve portfolio efficiency while maintaining quality and liquidity discipline.3
Notes on the fourth quarter of 2025
An 11 bp increase in the discount rate resulted in liabilities modestly falling, while equities increased 3% in the fourth quarter. We estimate the funded status of extant pension plans in the S&P 500 was flat during the quarter and increased 6 percentage points on the year. We assume a 50/50 split between growth assets and hedging assets which is the average allocation for plans in the S&P500.
The Treasury curve bull‑steepened during Q4 2025 and over the year, as short-maturity yields moved lower while long-end rates increased. Market sentiment was shaped by the Federal Reserve’s ongoing policy-easing cycle and a steady flow of data pointing to a gradual loss of economic momentum. Front-end yields responded most sharply to expectations of additional accommodation, whereas longer-term yields reflected lingering uncertainty surrounding inflation persistence and the term premium.
Corporate credit conditions remained firm in the fourth quarter and modestly tighter on the year. Early in the quarter, demand for high-quality issuers persisted, yet the combination of stronger Treasury yields and year-end positioning led to a gentle re-pricing of risk premia. Issuance was steady, and the market largely absorbed supply against a backdrop of stable fundamentals, though the bias shifted away from the aggressive spread compression seen previously. During the quarter, the Long Corporate OAS widened to 92 bps from 88 bps but declined from its year-end 2024 level of 98 bps. Long Gov/Credit OAS edged to 44 bps from 43 bps and fell from its prior year-end level of 54 bps. From a liability perspective, the FTSE AA discount rate increased to 5.32% (up 11 bps from 5.21%) during the quarter but finished the year lower by 12 bps.
Our representative equity portfolio had a total return of 3% for the quarter and 21% for the year. For this purpose, we use a mix of S&P 500 (45%), Russell 2000 (25%), MSCI EAFE (20%) and MSCI EM (10%), reflecting the breadth of equity holdings in most plans.
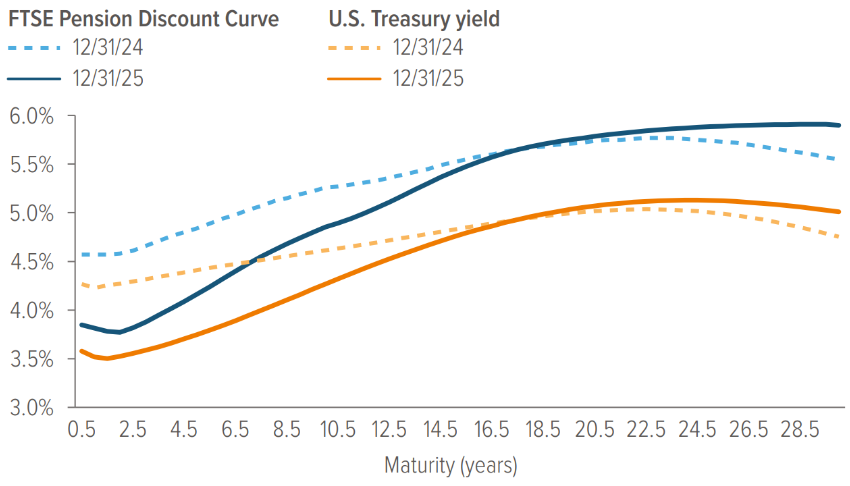
Source: ICE Index Platform, FTSE pension discount curve.
- The U.S. Treasury spot rate curve is flatter than the FTSE pension discount curve as of 12/31/2025.
- It is clear to see that both the Treasury spot rate and FTSE discount curves bull steepened compared to a year ago, pivoting around the 15 year point.
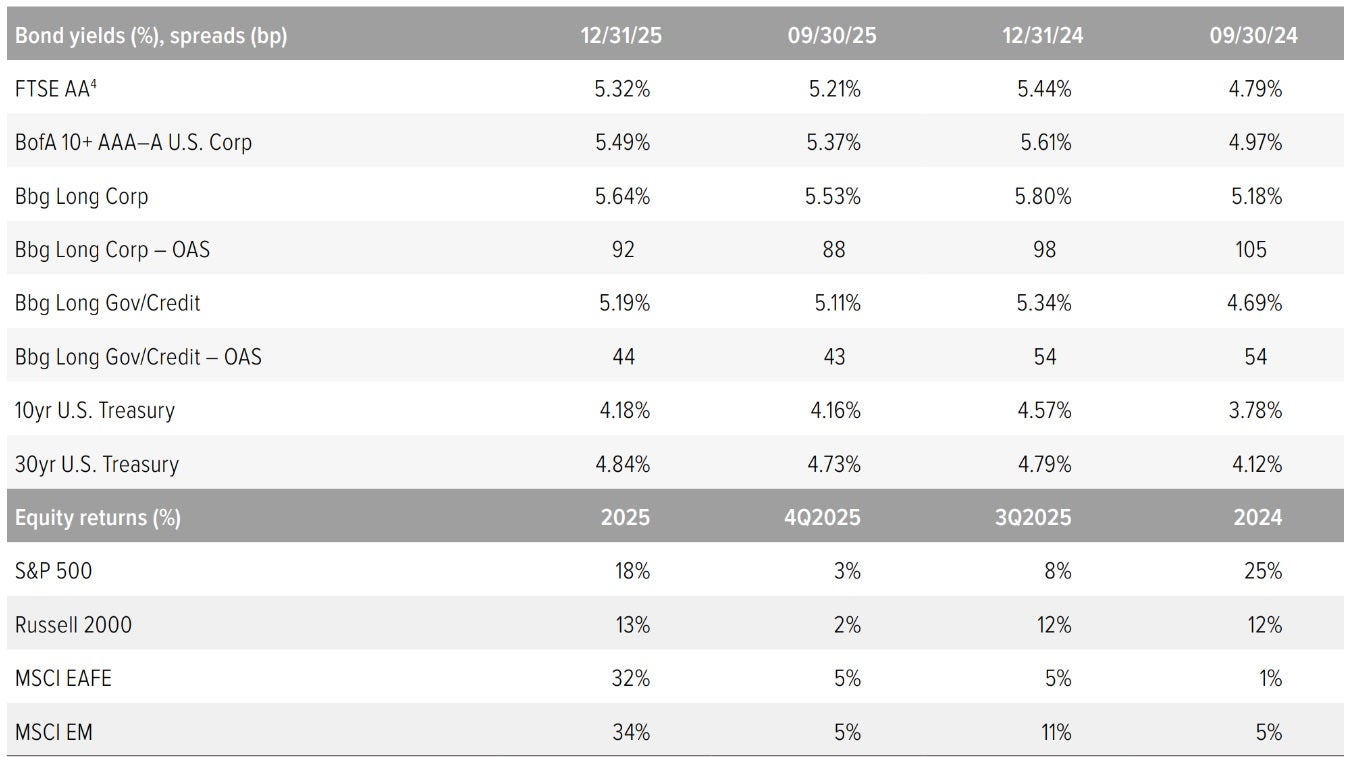
Source: FTSE, Barclays Live, ICE Index Platform, S&P, MSCI, Russell. See back page for index definitions.
A note about risk: Examples of LDI (liability-driven investing) performance included in this material are for illustrative purposes only. Liability valuations can increase due to falling interest rates or credit spreads, among other things, as the present value of future obligations increases with falling rates and falling spreads. Liabilities can also increase due to actual demographic experience differing from expected future experience assumed by the plan’s actuary. Diversification neither assures nor guarantees better absolute performance or relative performance versus a pension plan’s liabilities. In addition, investing in alternative investment products such as derivatives can increase the risk and volatility in an investment portfolio. Because investing involves risk to principal, positive results and the achievement of an investor’s goals are not guaranteed. There are no assurances that any investment strategy will be profitable on an absolute basis or relative to the pension plan’s liabilities. Information contained herein should not be construed as comprehensive investment advice. For comprehensive investment advice, please consult a financial professional.