Voya Corporate Pension Intelligence Update: 3Q25

LDI Solutions Strategist

While stable markets helped lift defined benefit plans’ funded status, anxiety mounts over recent auto industry bankruptcies.
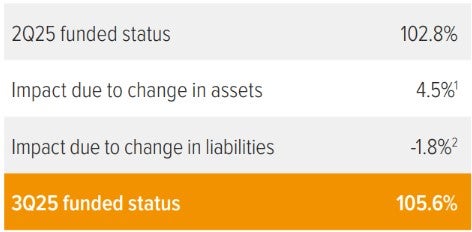
1 Growth asset return on the quarter was based on equity returns of 9%. Hedging assets, which match liability duration by design, increased due to 14 bps decline in discount rate. After reflecting benefit payments total net asset return is almost 4%.
2 Liabilities modestly increased during the quarter due to 14 bp decrease in rates with plan duration of 11 years and accounting for service accruals and benefit payments.
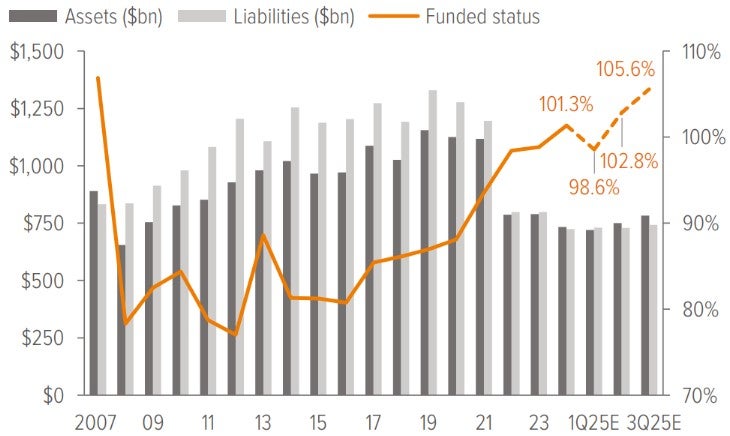
As of 09/30/25. Source: S&P, FYE 2024 company reports, Voya IM calculations and 2025 estimates. Assumes a 50% / 50% split in growth and hedging assets.
In the spotlight: Lemon or leading indicator?
This quarter, headlines were dominated by the collapses of First Brands Group and Tricolor Holdings, two high-profile auto industry credit events that rattled parts of the below investment grade leveraged loan markets and ABS sectors. While the stories are dramatic, we view them as idiosyncratic failures, not indicators of systemic risk. In other words: They’re lemons, not leading indicators.
First Brands, a major auto parts supplier with a B+ credit rating, filed for bankruptcy after revelations of opaque financing and alleged double-pledging of receivables. The company reportedly had over $10 billion in liabilities, including upwards of $2 billion in financing that remains unaccounted for. Federal investigations are under way, and creditors—including Jefferies and UBS—face significant exposure due to off-balance-sheet factoring arrangements. The bulk of First Brands’ debt was below investment grade leveraged loans, which affects an institutional investor audience primarily through their presence in a handful of collateralized loan obligations (21 U.S. CLOs have exposure of 1% or more).
Tricolor, an auto lender focusing on undocumented, subprime borrowers, abruptly shut down operations and filed for Chapter 7 liquidation amid fraud allegations. The firm allegedly pledged the same auto loan portfolios to multiple banks, triggering potential losses of up to $200 million for institutions like JPMorgan and Fifth Third. The event has led to wider spreads in subprime ABS and renewed scrutiny of servicing and collateral practices.
At Voya, we see these as isolated breakdowns of already-troubled below investment grade borrowers, with minimal impact on investment grade private credit or the institutional-grade securitized credit market. Our Investment Grade Private Credit and Securitized Credit teams operate with rigorous underwriting standards, robust governance, and institutional-grade risk management. In a landscape where tight public investment grade spreads are causing some managers to push risk, these events underscore the importance of platform quality and discipline—areas where Voya is widely regarded as strong.
Importantly, Voya has limited, de minimis exposure to either First Brands or Tricolor. Our portfolios are built to withstand episodic volatility, and our investment process is designed to avoid precisely these types of risks. For investors, the message is clear: confidence in investment-grade private credit and both public and private (ABF) securitized credit starts with confidence in your manager. With Voya, you’re investing in a platform that combines deep expertise with a commitment to transparency and resilience.
Notes on the third quarter of 2025
Discount rate and liabilities were essentially unchanged over the quarter, while equities increased 9%. We estimate the funded status of extant pension plans in the S&P 500 increased from 103% to 106% during the quarter. We assume a 50/50 growth assets and hedging assets which is the average allocation for plans in the S&P500. Equity returns for the second quarter for a common mix of assets held by many sponsors was almost 9%, giving funded status a boost.
The treasury curve bull steepened during Q3 2025, increasing its upward slope with lower short-end rates. The 2-year UST declined by 12 bps while the 10-year fell by 7 bps, and the 30-year fell by 5 bps. The quarter was marked by a modest bull steepening in the yield curve, driven by a decline in front-end rates following the Fed’s first rate cut in September and soft labor market data, including a July payroll miss. While long-end yields also declined, they did so more modestly, reflecting persistent inflation uncertainty and term premium. The curve steepened as markets priced in further easing, with short rates falling around 12 basis points, signaling investor caution rather than growth optimism.
Corporate bond spreads narrowed in Q3 2025 to multi-decade tights. Early in the quarter, risk-on sentiment prevailed as investors responded to softening labor data and growing expectations for Fed easing. July and August saw limited net issuance and strong technical demand, with investors favoring high-quality corporate balance sheets amid signs of softer growth. September brought a spike in volatility around the Fed’s first rate cut of the year, but the market absorbed a record $226 billion in new investmentgrade supply, supported by robust inflows and stable fundamentals. The long corporate index OAS ended the quarter 12 bps tighter, at 88 bps. The net result of rate and spread movements during the quarter was a 14 bp decrease in the FTSE Pension Discount Rate for short-duration plans (approximately 10 years). For a plan with a duration of 11 years, this translated to a modest increase in liabilities due to decline in Treasury yields further largely compounded by tighter credit spreads by quarter-end.
Our representative equity portfolio had a total return of 9%. For this purpose, we use a mix of S&P 500 (45%), Russell 2000 (25%), MSCI EAFE (20%) and MSCI EM (10%), reflecting the breadth of equity holdings in most plans.
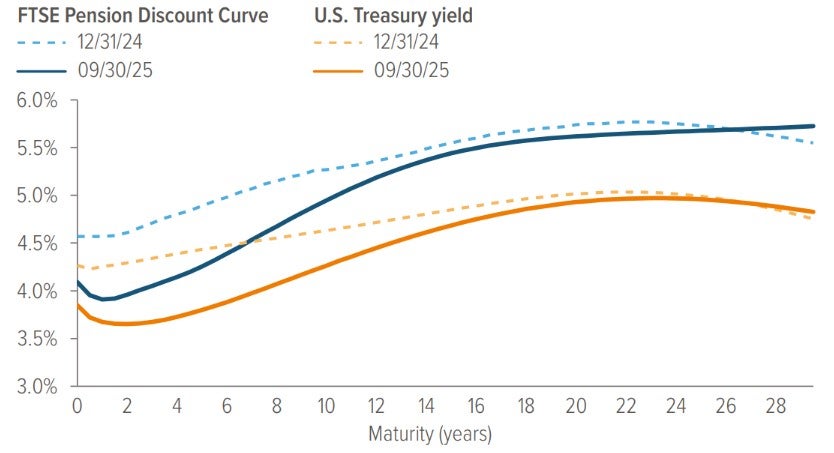
Source: ICE Index Platform, FTSE pension discount curve.
- The U.S. Treasury spot rate curve is flatter than the FTSE pension discount curve as of 9/30/2025.
- For the 15-year tenor, the U.S. Treasury spot rate is lower as of 9/30/2025 vs. 12/31/2024.
- Similarly, for the 15-year tenor, the Aa-rated corporate bond spot rate is lower as of 9/30/2025 vs. 12/31/2024.
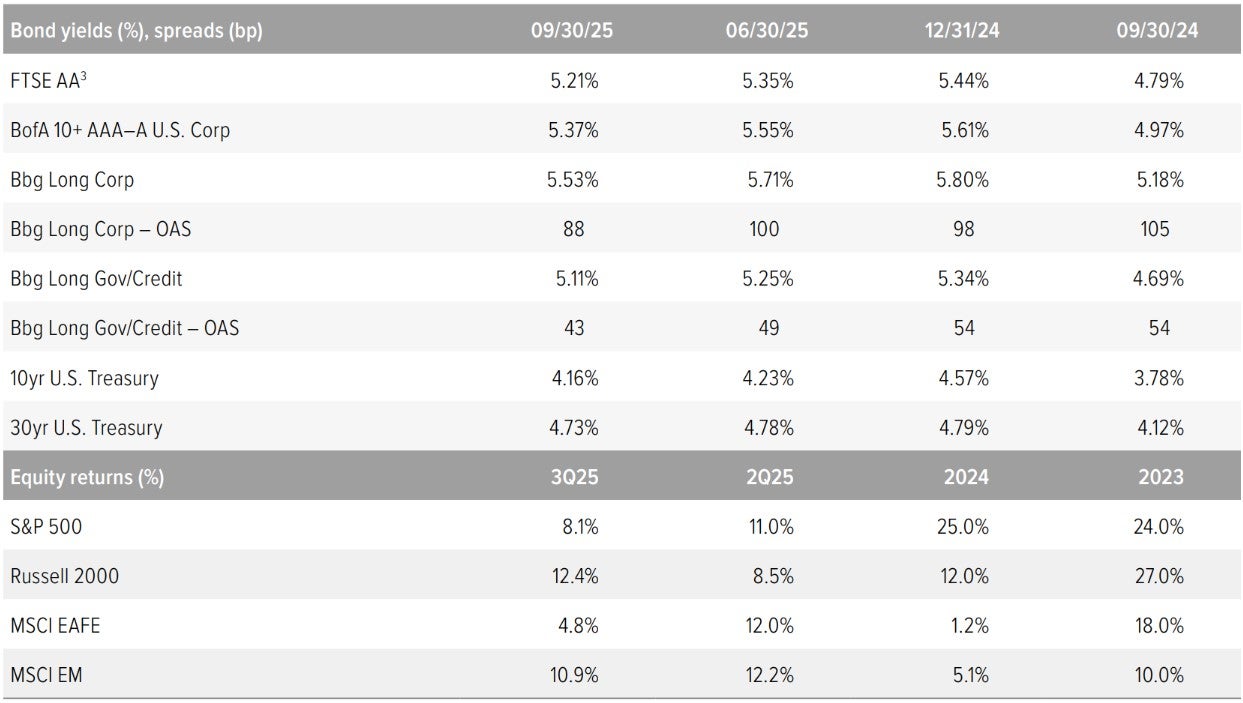
Source: FTSE, Barclays Live, ICE Index Platform, S&P, MSCI, Russell. See back page for index definitions.
3 Based on FTSE’s “short” duration plan, approximately 10.9 years.
A note about: risk Examples of LDI (liability-driven investing) performance included in this material are for illustrative purposes only. Liability valuations can increase due to falling interest rates or credit spreads, among other things, as the present value of future obligations increases with falling rates and falling spreads. Liabilities can also increase due to actual demographic experience differing from expected future experience assumed by the plan’s actuary. Diversification neither assures nor guarantees better absolute performance or relative performance versus a pension plan’s liabilities. In addition, investing in alternative investment products such as derivatives can increase the risk and volatility in an investment portfolio. Because investing involves risk to principal, positive results and the achievement of an investor’s goals are not guaranteed. There are no assurances that any investment strategy will be profitable on an absolute basis or relative to the pension plan’s liabilities. Information contained herein should not be construed as comprehensive investment advice. For comprehensive investment advice, please consult a financial professional.