
Key Takeaways
Excess capital yield (ECY) measures deployable capital, not historical payouts.
Over nearly two decades, ECY has outperformed traditional value metrics with lower volatility, across sectors and through multiple market cycles.
The components of ECY (cash, leverage, earnings power) turn a number into a research agenda.
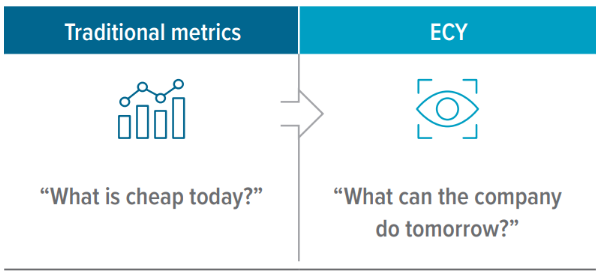
Dividend yield reflects what a company paid; price-to-book what it owns. Neither captures what it can do next.
What dividend yield doesn’t show
Value investing was built for a world of tangible assets: factories, inventory, real estate. Dividend yield and price-to-book made sense there. That world still exists, but it’s no longer the whole market. Today’s most capital-efficient businesses carry modest book values and thin dividends. Traditional metrics flag them as expensive. What they’re actually missing is the capital those companies have available to deploy.
We’ve shifted our focus to a measure we call excess capital yield (ECY). It measures the capital a company has available to create value after accounting for what it needs to operate and what it owes on its balance sheet.
ECY doesn’t replace fundamental analysis; it improves it. The metric raises the right questions: What does the balance sheet actually look like? What are the earnings prospects over coming years? Does management allocate capital with discipline? From there, experienced analysts interpret what the numbers reveal and translate findings into portfolio conviction.
The value trap problem
Price-to-book and dividend yield still work in some sectors, but they systematically miss value in others.
Consider a technology or health care company with strong earnings power, high returns on capital, and a fortress balance sheet—but a thin dividend and modest book value. Yet management has enormous flexibility to create value through reinvestment, M&A, or buybacks.
Conversely, a low price-to-book can signal either real opportunity or a value trap—risk dressed up as value. Without understanding a company’s available capital and its track record of deploying it, the difference can be difficult to see.
Three inputs, one signal
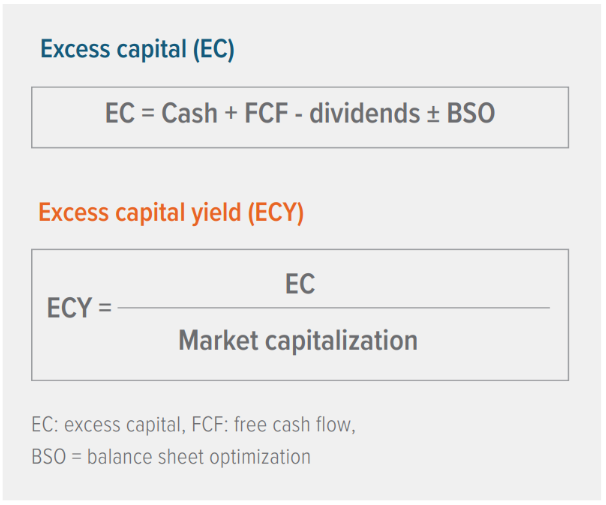
To determine a company’s excess capital, we add cash on the balance sheet plus two years of forward cash flow, and subtract dividends already paid. We then apply a balance sheet adjustment that reflects the competitive implications of leverage. Companies with lower leverage relative to peers have more flexibility to deploy capital; those with higher leverage have less.
We divide this excess capital figure by market capitalization to arrive at a yield, then analyze it on a sector-by-sector basis.
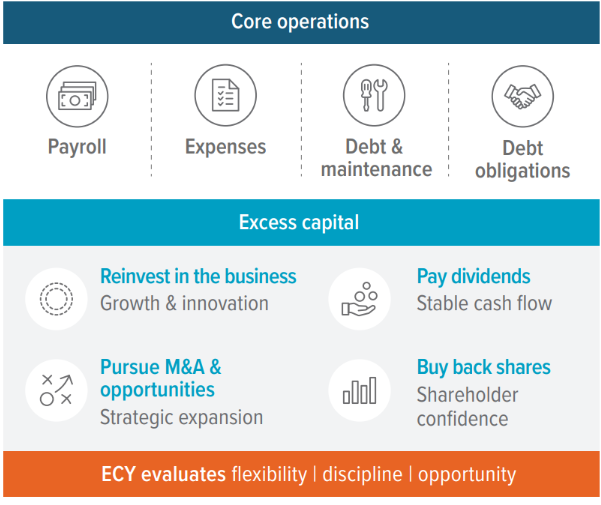
ECY is not a static number. It’s a measure of dry powder—how much room management has to act. It points analysts toward questions about balance sheet health, margin sustainability, and earnings power over coming years.
Consistency across market regimes
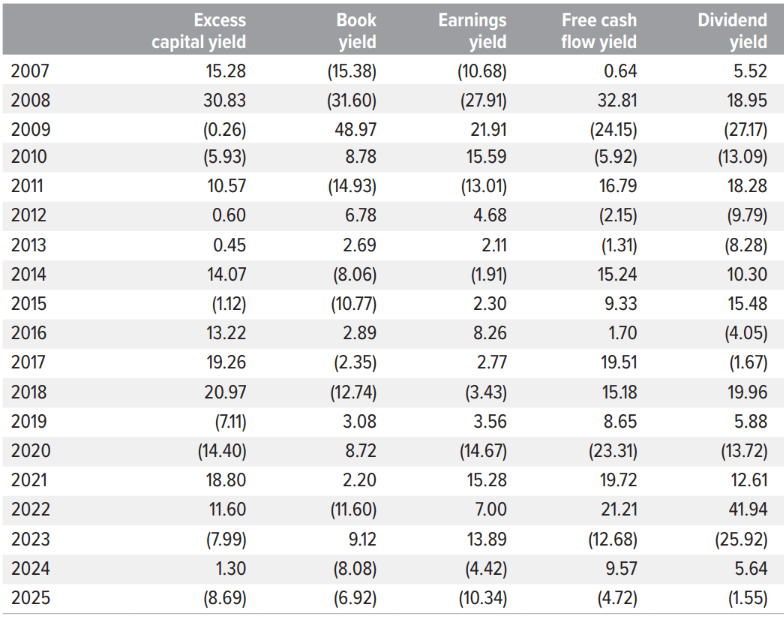
We evaluated the Russell 1000 Value Index from 2007 through December 31, 2025, testing ECY against free cash flow, book yield, earnings yield, and dividend yield—the standard value metrics used across the industry—excluding financials, REITs, and utilities due to structural limits on discretionary capital allocation.
ECY outperformed all four across the full period and across virtually every market regime.
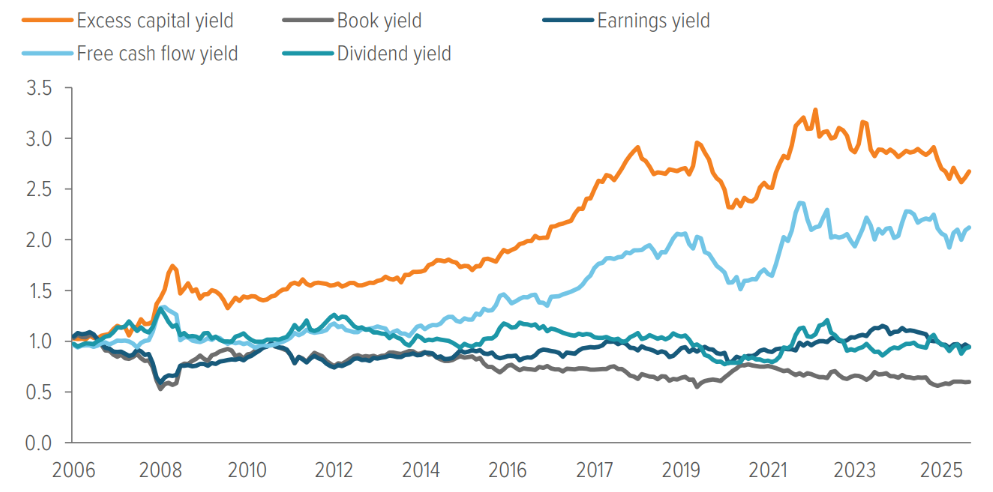
As of 12/31/25. Source: FactSet, analysis by Voya Investment Management. Past performance does not guarantee future results.
Over the 2007-2025 period, ECY delivered 5.31% annualized returns with 10.48% annualized volatility. The Sharpe ratio was 0.51—substantially stronger than competing metrics, which ranged from -0.19 to 0.34.
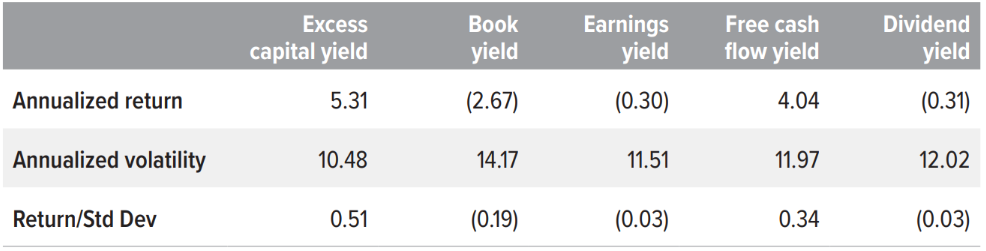
As of 12/31/25. Source: FactSet. Analysis by Voya IM. Annualized volatility measures how much a factor’s returns fluctuate over the course of a year. A lower number indicates steadier performance. Past performance does not guarantee future results.
This advantage holds up across sectors. In six of eight sectors we examined, ECY led the field over the period.
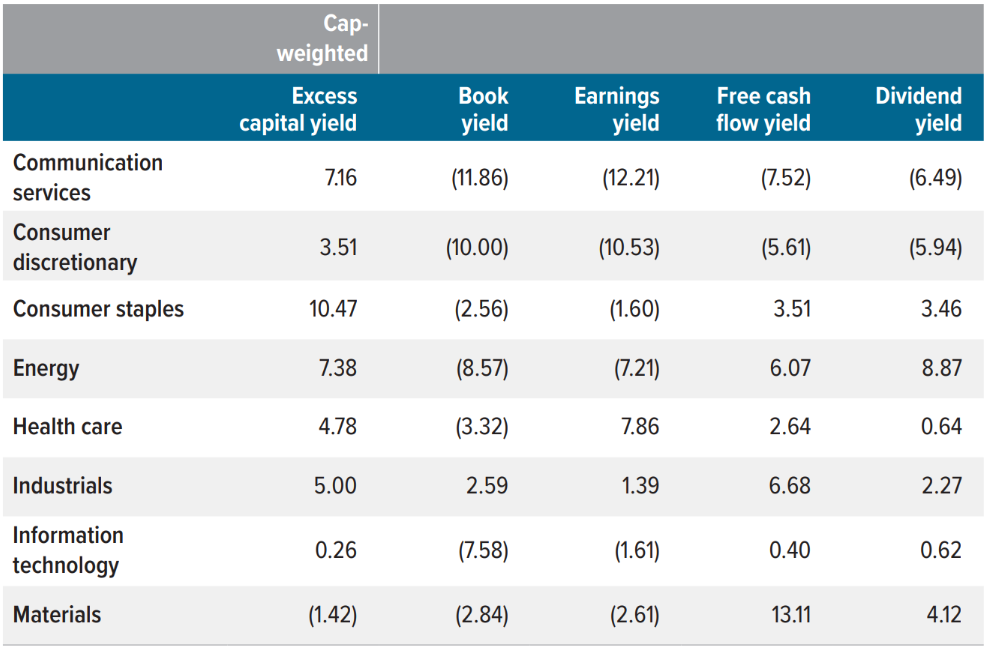
As of 12/31/25. Source: FactSet. Analysis by Voya IM. Past performance does not guarantee future results.
High-ECY companies tend to carry less debt and generate stronger profits—a combination that offers a built-in quality filter. Companies with excess capital have more room to weather downturns, invest in competitive advantages, and reward shareholders. Companies without it are often trapped.
We measured the correlation of ECY with profitability and leverage across the study period. High ECY companies showed higher profitability (correlation: 0.35) and lower leverage (correlation: -0.57) compared with other value metrics, which is why ECY helps avoid value traps.
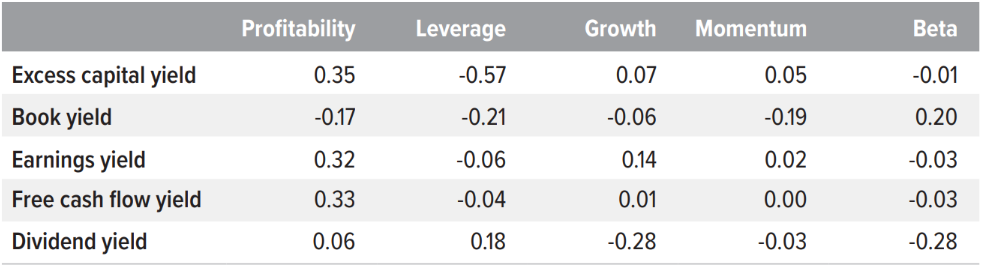
As of 12/31/25. Source: FactSet. Analysis by Voya IM. Past performance does not guarantee future results.
ECY shows consistent leadership across both calm and volatile periods. It leads in most years, not all. When other metrics outperform, the margin is narrow; when ECY does, the gap is wide.
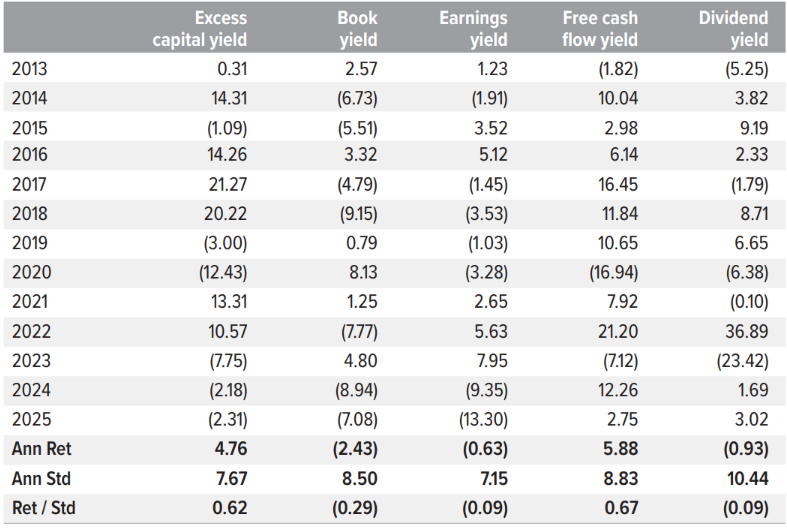
As of 12/31/25. Source: FactSet. Analysis by Voya IM. Past performance does not guarantee future results.
As of 12/31/25. Source: FactSet. Analysis by Voya IM. Past performance does not guarantee future results.
From signal to conviction
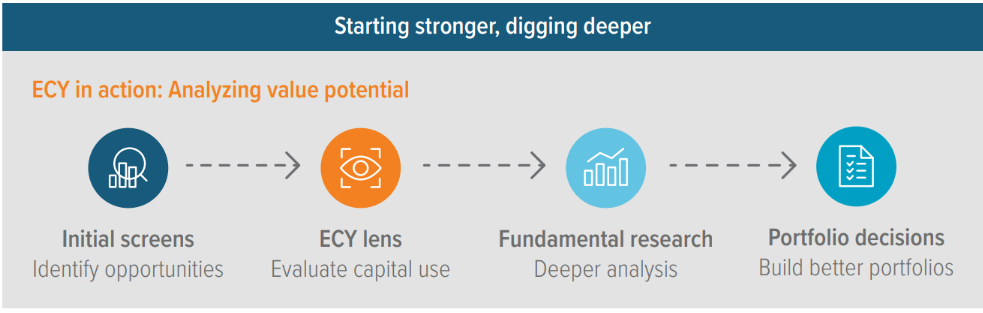
ECY isn’t a screen to run blindly; it’s a starting point for rigorous research. A high ECY score signals that an analyst should look deeper. What's driving excess capital? How is the company deploying it? What does management's track record show? These questions turn a number into a research agenda.
At Voya, we triangulate ECY against relative value measures and sector-level fundamental insights, assessing valuation support, balance sheet strength, and capital allocation discipline.
A different starting point for value investing
ECY is a "quantamental" metric: the quantitative side finds the signal; the fundamental side determines whether it holds.
In the Voya Large Cap Value strategy, that combination translates into a more disciplined approach to capital allocation. Nearly two decades of evidence suggests it works.
Our approach is different. So are the results.