LDI Quarterly Update: 3Q24

LDI Solutions Strategist

U.S. pension plans’ average funded status deteriorated slightly in 3Q24 to 103.2%, as a decline in the discount rate increased liabilities more than was offset by positive equity returns. In this issue, we take a closer look at the recent disinversion of the yield curve through an LDI lens.
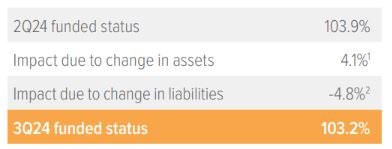
1 Growth asset return on the quarter was based on equity return of 7%, hedging assets (which match liability duration) of 5% increase (similar to liabilities, by design), after reflecting benefit payments and timing netted a 3.8% portfolio return.
2 Liabilities grew 4.4% during the quarter due to a 50 bp decrease in rates with plan duration of 11 years, accounting for service accruals and release from benefits payments.
As of 09/30/24. Source: S&P, FYE 2023 company reports, Voya IM calculations and 2024 estimates assuming a 50% / 50% split in growth and hedging assets.
In the spotlight: Disinversion through an LDI lens
An LDI program is rate agnostic by design. That indifference to rate moves extends to any change across the yield curve. When the key rate duration (KRD) of the hedging asset portfolio is mapped to the KRD of the pension liability profile, movements in the yield curve—whether it be a twist, a steepening, or an inversion—will impact hedging assets and liabilities in the same fashion. In a very real sense, LDI’s alignment of the KRDs immunizes the non-equity portion of the portfolio to rate and curve changes. Thus, in a fully blossomed LDI program, the yield curve’s disinversion is a non-event.
However, during a yield curve inversion, active investment managers may shift their investment posture in a bid for alpha, buying shorter-duration bonds and locking in the desirable, higher yields. This provides better carry to the portfolio with less volatility than in the long end. This is typically done in tandem with derivatives to manage curve risk and preserve the target interest rate hedge ratio. It may even be done by shifting allocations from growth-seeking assets, as it is comparable to an expected equity return given the current yield environment.
Irrespective of the capital source, shorter-duration bonds can provide liquidity for benefit payments, functioning like a high-yield checking account.
Now that the curve has disinverted and may continue to steepen, expect investment managers to reverse course and sell shorter-dated paper as they shift back towards longer-duration bonds to lock in higher yields. All of this is done with an eye towards ensuring the interest rate hedge ratio is not compromised.
Notes on the third quarter of 2024
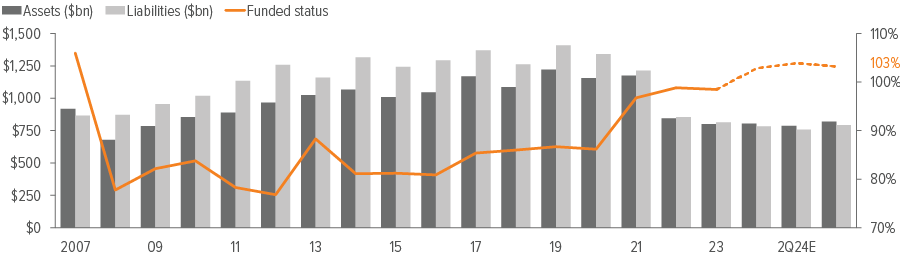
Discount rate decline resulted in deterioration of funded status during Q3. We estimate the average funded status of extant pension plans in the S&P 500 declined from 103.9% to 103.2% during the quarter. A decrease in the discount rate increased liabilities more than was offset by equity returns.
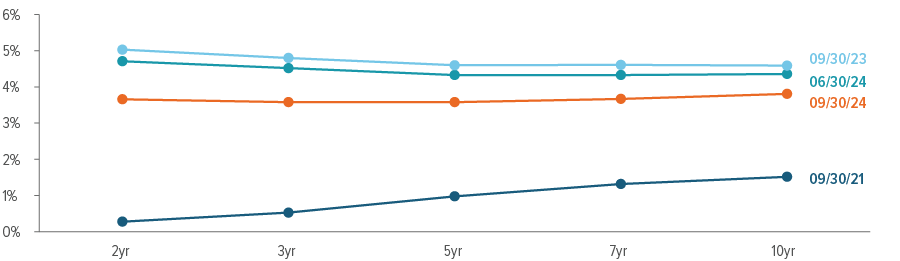
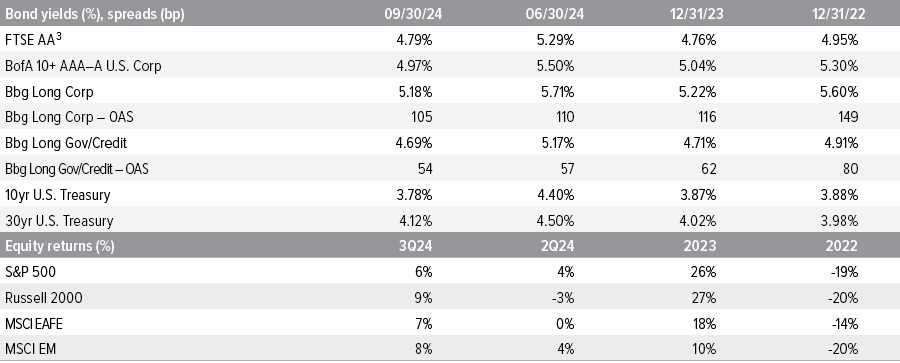
The 2s-10s Treasury curve disinverted in early September as the 2yr rallied 30 bp. The 10yr UST yield declined 62 bp during the quarter and the 30yr yield was down 38 bp. With the 10yr UST declining more than the 30yr, there was an overall steepening of the previously nearly flat yield curve.
Credit spreads narrowed slightly, and are at their tightest in decades. The net result of rate and spread movements during the quarter was a 50 bp decrease in the FTSE Pension Discount Rate for short-duration plans. For a plan with a duration of 11 years, this roughly translates to a 5% increase in liabilities due to these changes alone.
Our representative equity portfolio had a total return of 7%, offsetting liability losses to buoy funded position. For this purpose, we use a mix of S&P 500 (45%), Russell 2000 (25%), MSCI EAFE (20%) and MSCI EM (10%), reflecting the breadth of equity holdings in most plans.
Source: FTSE, Barclays Live, ICE Index Platform, S&P, MSCI, Russell. See back page for index definitions.
3 Based on FTSE’s “short” duration plan, approximately 10.9 years.
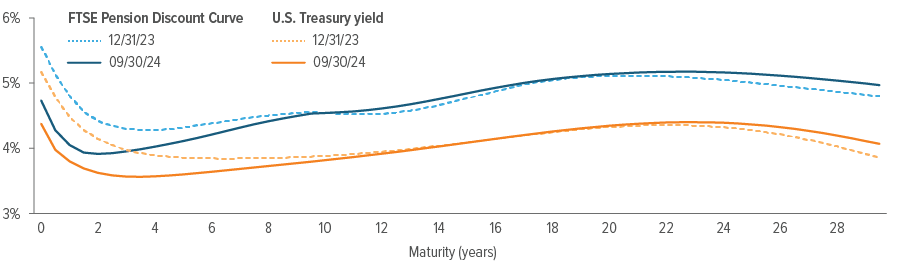
Source: ICE Index Platform, FTSE pension discount curve.
- The US Treasury spot rate curve is flatter than the FTSE pension discount curve as of 9/30/2024.
- For the 15-year tenor, the U.S. Treasury spot rate is the same as of 9/30/2024 vs. 12/31/2023.
- However, for the 15-year tenor, the Aa-rated corporate bond spot rate is higher as of 9/30/2024 vs. 12/31/2023.
A note about risk Examples of LDI (liability-driven investing) performance included in this material are for illustrative purposes only. Liability valuations can increase due to falling interest rates or credit spreads, among other things, as the present value of future obligations increases with falling rates and falling spreads. Liabilities can also increase due to actual demographic experience differing from expected future experience assumed by the plan’s actuary. Diversification neither assures nor guarantees better absolute performance or relative performance versus a pension plan’s liabilities. In addition, investing in alternative investment products such as derivatives can increase the risk and volatility in an investment portfolio. Because investing involves risk to principal, positive results and the achievement of an investor’s goals are not guaranteed. There are no assurances that any investment strategy will be profitable on an absolute basis or relative to the pension plan’s liabilities. Information contained herein should not be construed as comprehensive investment advice. For comprehensive investment advice, please consult a financial professional. |