LDI Quarterly Update: 1Q24

Oleg Gershkovich, A.S.A., M.A.A.A.
LDI Solutions Strategist

Brett Cornwell, CFA
Co-Head of Client Portfolio Management, Fixed Income

Most U.S. plans are now 110% funded. Pivoting to cash flow driven investing can reduce admin costs while better managing liquidity needs.
As of 3/31/24. Source: S&P, FYE 2022 company reports, Voya IM calculations and 2023 estimates.
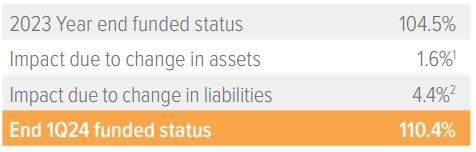
1 Growth assets based on S&P 500 return of 11%; hedging assets (which match liability duration) had a 3% loss, similar to liabilities, by design, also reflecting benefit payments.
2 Liabilities decreased 3% due to 29 bp increase in rates and plan duration of 12 years, based on the FTSE pension discount curve, further adjusted for service accruals and benefits payments.
As of 3/31/24. Source: S&P, FYE 2022 company reports, Voya IM calculations, 2023 and 2024 estimates.
In the spotlight: The re-emergence of cash flow driven investing
CDI: An efficient way to manage liquidity needs for overfunded plans too
As plans continue to benefit from improved funded levels and increased allocations to lower-risk assets, cash flow driven investing (CDI) has re-emerged as a strategy that can help ensure liquidity needs are met efficiently.
Typically, CDI is implemented when sponsors find themselves in a negative cash flow position—when their benefit payments and expenses exceed their contributions, and their ability to make timely payments takes precedence over their need for long-term equity returns.
CDI was implemented in this context to secure front-end benefit payments, with carefully laddered and earmarked assets that mature and match benefit payments plus expenses as they come due. This allowed sponsors to risk up the remaining assets in underfunded plans as a strategy to close a deficit.
However, with plans finding themselves fully funded recently, the ever-increasing allocations to hedging assets have created a concern around selling out of those assets to cover benefit payments. This has resulted in a re-examination of CDI as a strategy that ensures assets mature concurrently with benefit payments and expenses as they come due. Put simply, it’s a way to efficiently manage liquidity needs. CDI is also especially advantageous in a time of elevated rates and an inverted yield curve, such as our current market environment. Sponsors can now meet the benefit payments and expenses organically with short duration high yield (but still investment grade) fixed income assets, which require less up-front funding than when rates are lower.
Voya’s approach to CDI
The key to successful CDI is a careful selection of fixed income instruments that considers the timing of coupon payments and maturities that are used to match the liability cash flows.
These assets are often held to maturity to capture certainty and clip coupons rather than pursuing total returns through active trading. The buy and hold approach provides the stability a sponsor seeks.
With CDI, we endeavor to lower sponsors’ administrative burden, with fewer manager withdrawal requests as well as lower transaction costs.
Typically, we only look within the investment grade ecosystem: Corporate debt, securitized credit rated A or better, and/or commercial mortgage loans. We consider and solve for a positive cumulative surplus at the end of the period.
Notes on the quarter
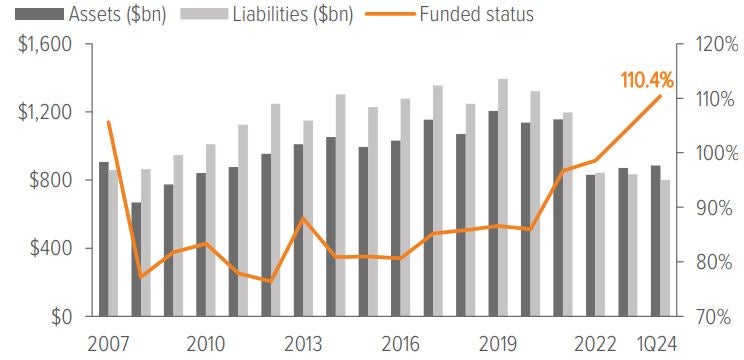
- The first quarter of 2024 posted another significant improvement in funded status for corporate U.S. pension plans, in aggregate. At the end of 1Q24, the funded status of extant pension plans in the S&P 500 is 110%, up from from 105% at year end. Funded levels are now higher than they were right before the global financial crisis.
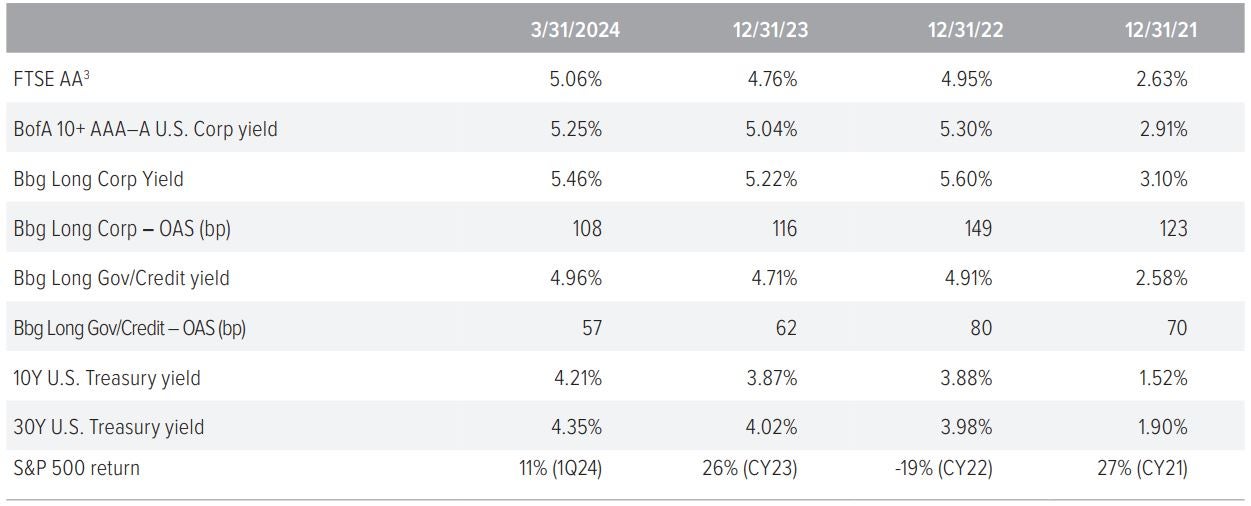
- The treasury curve shifted upward during the quarter, with the 10yr UST and 30yr UST yields both increasing 33 bp.
- Credit spreads narrowed even more. The net result of rates and spreads was a 29 bp increase in discount rate of in Q1. For a plan with duration 12, this translates to a 3% decrease in liability due to rates during Q1.
- U.S. equities had a total return of 11% for the quarter, significantly contributing to the improved funded position.
Source: FTSE, Barclays Live, ICE Index Platform, See page 3 for index definitions.
3 Based on FTSE’s “short” duration plan, approximately 11.1 years.
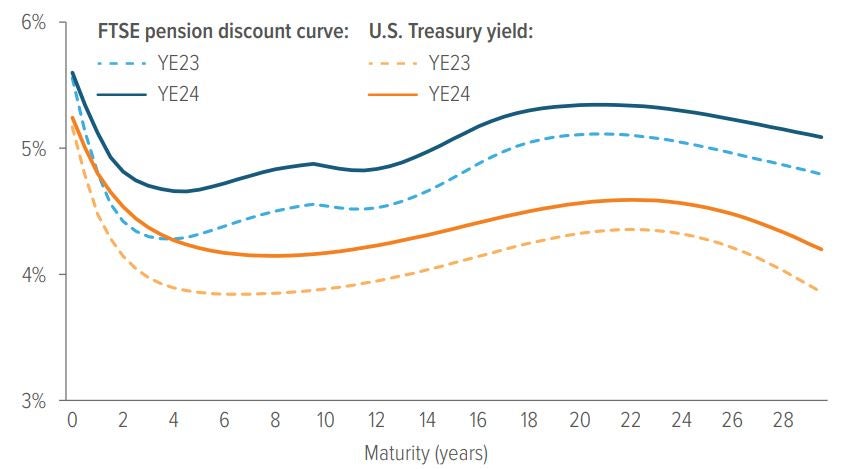
- The US Treasury spot rate curve is flatter than the FTSE pension discount curve as of 3/31/2024.
- For the 15-year tenor, the US Treasury spot rate is higher as of 3/31/2024 versus 12/31/2023.
- Similarly, for the 15-year tenor, the Aa-rated corporate bond spot rate is higher as of 3/31/2024 versus 12/31/2023.
A note about risk Examples of LDI (liability-driven investing) performance included in this material are for illustrative purposes only. Liability valuations can increase due to falling interest rates or credit spreads, among other things, as the present value of future obligations increases with falling rates and falling spreads. Liabilities can also increase due to actual demographic experience differing from expected future experience assumed by the plan’s actuary. Diversification neither assures nor guarantees better absolute performance or relative performance versus a pension plan’s liabilities. In addition, investing in alternative investment products such as derivatives can increase the risk and volatility in an investment portfolio. Because investing involves risk to principal, positive results and the achievement of an investor’s goals are not guaranteed. There are no assurances that any investment strategy will be profitable on an absolute basis or relative to the pension plan’s liabilities. Information contained herein should not be construed as comprehensive investment advice. For comprehensive investment advice, please consult a financial professional. |