Voya Enhanced Long Duration Government/ Credit: An Eight-Year Track Record to Celebrate

LDI Solutions Strategist

Co-Head of Client Portfolio Management, Fixed Income

Key Takeaways
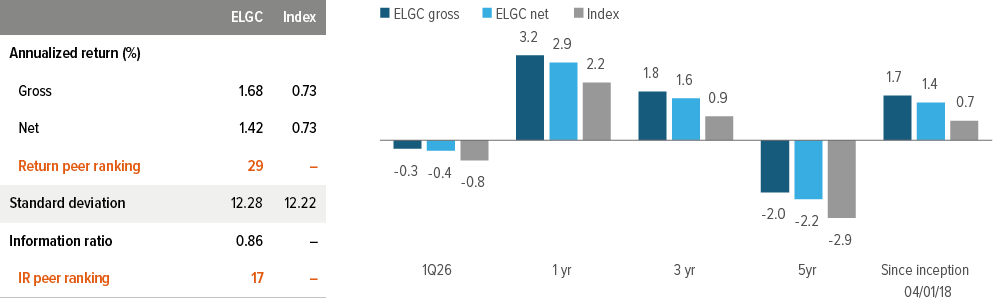
Since its 2018 inception, ELGC has outperformed the Bloomberg U.S. Long Government/Credit Index and bested other asset managers—landing ELGC in the top third of its peer group since inception.1
ELGC enhances diversification with investment grade private credit as a complement to public corporate securities, historically providing higher yield and total return while reducing overall risk (top-quintile information ratio vs. peers).1
Its longer duration can benefit a variety of corporate pension plan types, boosting total portfolio duration and hedge ratio.
The Voya Enhanced Long Duration Government/Credit (ELGC) Strategy celebrated its eighth anniversary in March 2026. We explore what makes ELGC stand out as a way for corporate pension plans to add duration and improve risk-adjusted returns.
What has been the reason for ELGC’s strong results?
The Strategy uses a differentiated approach that has produced attractive results since inception:
- Outperformed its benchmark (the Bloomberg U.S. Long Government/Credit Index) with a similar risk profile (Exhibit 1)
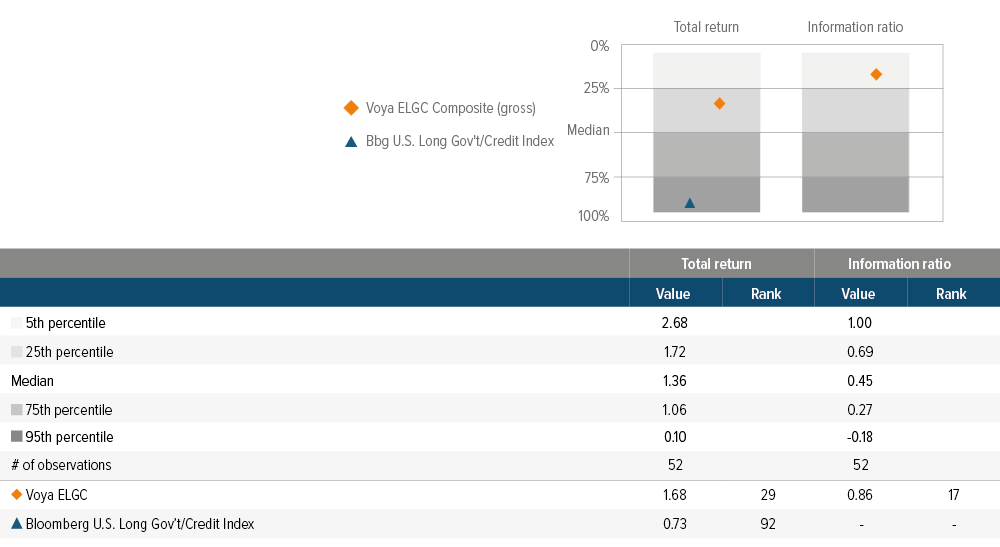
- Exhibited strong results within its eVestment peer group, ranking in the 29th percentile for absolute returns and 17th percentile for risk-adjusted returns since inception (Exhibit 2)1
- Provided improved portfolio diversification, stronger downside resilience, and higher yields
We believe a key reason for these results is the way we thoughtfully expand the investment opportunity set. ELGC manages investment risks in the same vein as traditional long-duration portfolios, but we can also allocate to off-benchmark asset classes such as investment grade private credit, commercial mortgage loans, and securitized credit, which traditionally have not been included in the long-duration tool kit.
As of 03/31/26. Source: eVestment Alliance, Voya IM calculations. See notes below.
As of 03/31/26. Source: eVestment Alliance, Bloomberg. Category: U.S. Long Duration—Gov’t/Credit Fixed Income. Past performance does not guarantee future results. Performance numbers for time periods greater than one year are annualized. The composite represents the investment results of a group of fully discretionary portfolios managed according to the Strategy. Returns include the reinvestment of income. Gross-of-fees returns are presented after trading expenses and before management and custodial fees, which, in addition to other fees incurred in the management of the portfolio, would further reduce returns. Net-of-fees returns are calculated by deducting a hypothetical management fee from the gross return on a monthly basis and geometrically linking the results to produce returns shown. The hypothetical management fee is equal to or greater than the asset-weighted average of each accounts’ fee schedule in the composite. The model fee used will result in a net return that is equal to or lower than a net return using actual fees. For a description of advisory fees, please see Form ADV, Part II. Gross returns should be used as supplemental information only. Please see “Schedule of Composite Performance” at the end of this document.
Why is “enhanced” in the Strategy’s name?
The word “enhanced” refers to the way we designed ELGC as a strategy seeking to deliver a benchmark-like risk profile, but with superior risk-adjusted returns by virtue of an expanded toolkit.
In the process of developing ELGC more than eight years ago, we found that most portfolios in the long-duration government/ credit peer group looked similar, typically overweighting corporate credit. Not surprisingly, these portfolios were concentrated in many of the same credits, given that the top 100 corporate issuers represented nearly 70% of the Long Corporate Index by market value.2
We decided to take a different approach that still fit the spirit of long-duration government/credit sought by plan sponsors. We felt strongly that a high-octane, alphaseeking strategy is generally not suitable for liability hedging portfolios. We wanted to deliver a benchmark-like risk profile in terms of duration and spread duration, but with an “enhanced” opportunity set with the potential for a more efficient return profile in addition to broader issuer diversification.
Comparing the portfolio with its benchmark (Exhibit 3), our approach is not to replace public credit, but rather to complement the allocation to public credit with investment grade private credit (PCIG). The allocation to PCIG tends to hover around 40%, adjusted up or down, based on relative value. The result is a higher-yielding portfolio (an incidental outcome; more on that below) with similar duration and credit quality relative to the benchmark.
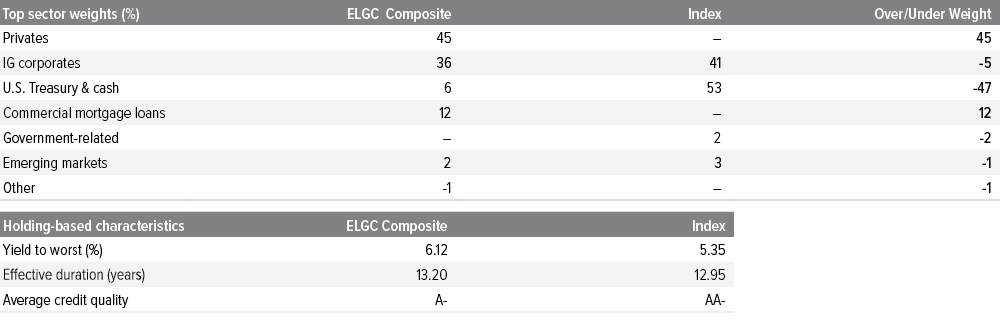
As of 03/31/26. Source: Blackrock Aladdin, Voya IM. The returns-based characteristics presented are based on the gross-of-fee composite returns. Characteristics are based on a representative account in the composite that we believe best represents the portfolio management style of the composite. Characteristics may be adjusted to exclude securities for which data is not available or for extreme data outliers via commonly used trimming methodologies. Past performance does not guarantee future results. Benchmark index: Bloomberg U.S. Long Gov’t/Credit Index. Additional information on the composition and results of the representative account portfolio is available upon request.
Why investment grade private credit?
There are four main reasons why we built in a sizeable allocation to private credit.
1. PCIG is more efficient than public long-duration corporates.
We aim to take spread risk in the belly of the yield curve—instead of at the long end—because there is lower spread volatility and less spread duration, which helps us capture more of the spread over time. Consider that a small change in long corporate spreads can wipe out the carry, compared with the same change in the intermediate part of the curve. Exhibit 4 illustrates how intermediate corporates (represented by the Bloomberg U.S. Credit Corporate 5–10 Year Index, which has a duration comparable to PCIG) have superior risk-adjusted returns compared with long corporates (represented by the Bloomberg U.S. Credit Corporate Index).
Based on the efficiency of intermediate credit versus long credit, ELGC has demonstrated better risk-adjusted returns than the average “regular” long government/ credit strategy, with a top-quintile information ratio over the trailing seven years. ELGC has also delivered greater upside capture and less downside capture than the benchmark (Exhibit 5)—one of only eight strategies above the median in both upside and downside capture.
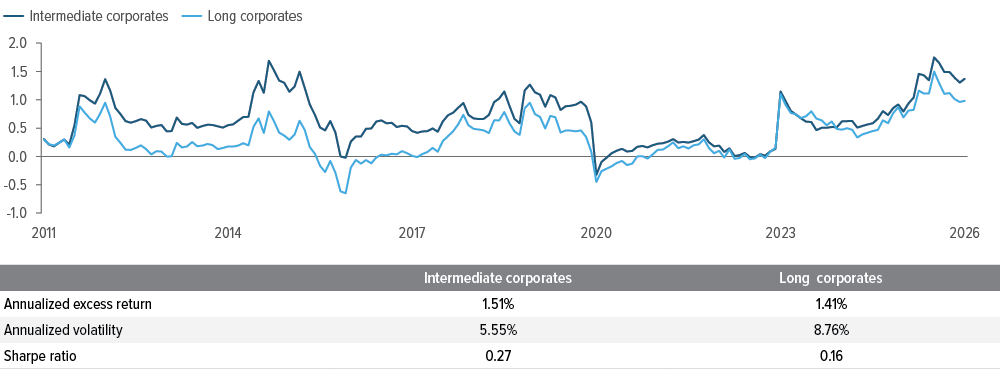
As of 03/31/26. Source: Bloomberg, Voya IM. Excess return is the return attributed to carry and spread change and excludes any change in interest rates (i.e., it is duration neutral and thus provides a common basis for comparison). Intermediate corporates: Bloomberg U.S. Credit Corporate 5–10 Year Index; long corporates: Bloomberg U.S. Credit Corporate Index.
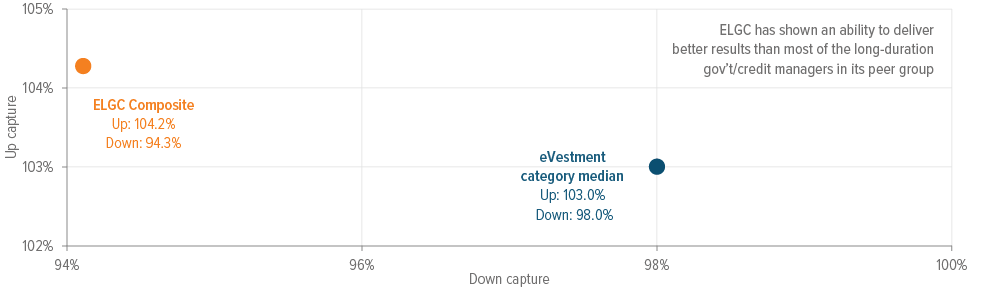
As of 03/31/26. Source: eVestment, Voya IM. Past performance does not guarantee future results. The ELGC composite represents the investment results of a group of fully discretionary portfolios managed according to the Strategy. Returns include the reinvestment of income. Gross returns are presented before management and custodial fees but after all trading expenses. The eVestment category median represents only one of seven peer strategies.
2. Private credit helps decrease idiosyncratic risk, which may benefit plans with multiple managers. ELGC’s 20% minimum allocation to PCIG also reduces the idiosyncratic risk that can arise from the high concentration of corporate issuers in the long-duration benchmarks. For plans that seek long-duration government/credit exposure, ELGC provides that in a more risk-efficient manner. In other words, even for plans not seeking to diversify a multi-manager roster, ELGC has shown an ability to deliver better results than most of the long-duration government/credit strategies in its peer group.
3. Private credit’s covenant packages provide downside protection to help mitigate credit events. This has resulted in fewer downgrades historically and, in the rare event of a default in an investment grade corporate bond, recoveries were generally higher with superior economics.3 This is an important point, as credit events such as ratings downgrades do not affect the liability discount rate. Thus, allocating to assets that have features to help mitigate downgrades is paramount in a liability-hedging portfolio.
4. PCIG includes more than just corporate credit, extending to sectors like infrastructure and assetbased finance (ABF). ABF is gaining institutional traction for its ability to deliver yield and diversification through exposures tied to tangible assets and contractual cash flows, such as equipment leases, receivables, and consumer finance. These sectors behave differently from traditional corporate credit and introduce economic factor exposures that can enhance portfolio resilience. Recognizing these subcategories within PCIG strengthens the case for its role in ELGC and reflects a broader opportunity set (Exhibit 6).
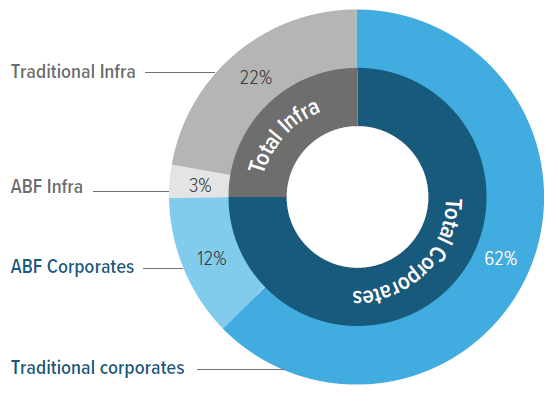
As of 03/31/26. Source: Voya IM. Data presented is based on assets held across proprietary insurance portfolios of Voya Financial and/or those managed for external clients of Voya IM.
Why the tendency of a 40% weight to PCIG?
In designing ELGC, our view was that PCIG—with all its desirable diversifying properties—could be included in a long-duration construct. Proving that hypothesis was not straightforward and required iterative backtesting. Among the challenges we uncovered:
- Add too much PCIG, and portfolios would fall far short of the target spread duration due to the inherent shorter spread duration of this asset class.
- Correcting for this shortfall would require extending the duration of public bonds, resulting in an undesirable “barbell” that exposes the portfolio to significant curve risk. The public corporate portion would become a de facto “completion” portfolio with an overweight to financial issuers, as PCIG has almost no exposure to financials.
- “Best ideas” approaches may become significantly compromised for both public corporate and PCIG investment teams. If we were to construct a public corporate bond portfolio that serves to “complete” around the private allocation, we may prevent Voya’s public investment grade team from doing what it does best—picking bonds—by potentially forcing it to invest in a narrower subset of longer duration to achieve the desired spread duration profile.
After multiple iterations, we found that a 40% allocation to PCIG was the sweet spot, engendering a symbiosis of best ideas and spread duration goals that helps to achieve the desired benefits while avoiding unintended risks.
Why is yield only slightly better than the benchmark?
We do not allocate to PCIG for the sole purpose of maximizing yield. This is not a high-beta, alpha-oriented “plus” strategy. The objective is to beat the benchmark with benchmark-like risk and to do so more efficiently. We allocate to off-benchmark investment-grade securities to expand the investment grade corporate spread product universe.
The yield advantage is also a function of the shape of the yield curve. Unless the curve is flat or inverted, long corporates will have greater yield compared to intermediates, even with the spread pick-up for PCIG. Also, some of the economic benefits of allocating to PCIG are captured in its total return (rather than its yield). Examples include the “back-end income” from prepayments, yield bumps, and other fees paid by the borrower for amendments—none of which show up in the stated yield.
Is ELGC right for my corporate plan?
Plan duration is a key factor in determining the fit for a pension plan. Given that the duration of ELGC is around 13 years, it may be an attractive option for certain corporate pension plans, including:
- Longer-duration plans that are open and accruing benefits
- Plans that are taking early steps towards long-duration fixed income and that have a de-risking posture within their hedging portfolio
- Plans that want exposure to PCIG but lack the size for a meaningful allocation to a separately managed account
- Plans that need longer duration than they could get from a standalone allocation to PCIG, since the duration of a mature PCIG allocation tends to be around six years
- Plans that are not fully hedged or fully funded (and may be closed/frozen), but seek to achieve a total portfolio duration in line with liability duration (Exhibit 7)
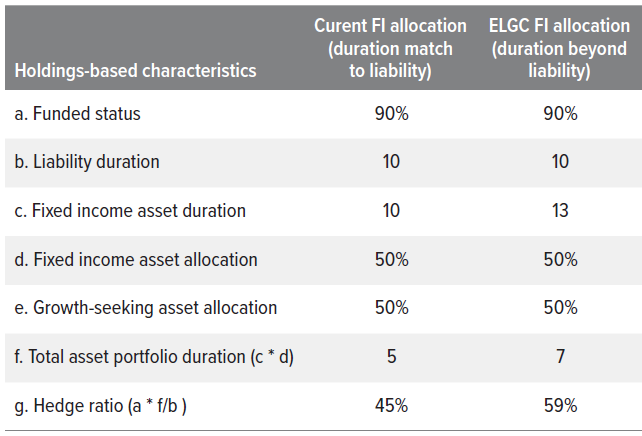
Source: Voya IM. For illustrative purposes only.
The sample portfolio on the left has a duration of 10 years (the same as the liability duration), diluted by both the growth-seeking allocation and the underfunded position, which proves insufficient to match liability duration when aggregated with the rest of the asset portfolio.
A longer-duration fixed income portfolio such as ELGC results in a higher total portfolio duration (almost 2 years) and a higher hedge ratio (59% vs. 45%).
Takeaways for investors
Off-benchmark allocations to PCIG can provide long-duration government/credit investors with three potential benefits:
- Portfolio diversification: By expanding the investment universe, we can mitigate ithe issuer concentration risk found in long duration indexes.
- Stronger downside protection: PCIG’s robust covenant packages may lead to lower credit losses, mitigating downside risk by minimizing credit rating migration.
- Higher yield potential: By allocating to PCIG, we earn a potential yield pickup from its upfront spread advantage and non-coupon income (e.g., prepayment and/or amendment fees).
Since its inception over eight years ago, the Voya Enhanced Long Duration Government/Credit Strategy has been a successful investment solution for corporate pension plans. It has outperformed the benchmark and reduced risk through diversification, resulting in better risk-adjusted returns compared with “regular” long government/credit strategies. As such, we believe it represents an attractive option for corporate pension plans seeking a reliable and successful investment strategy.
Appendix: Schedule of composite performance
Voya Enhanced Long Duration Government/Credit composite
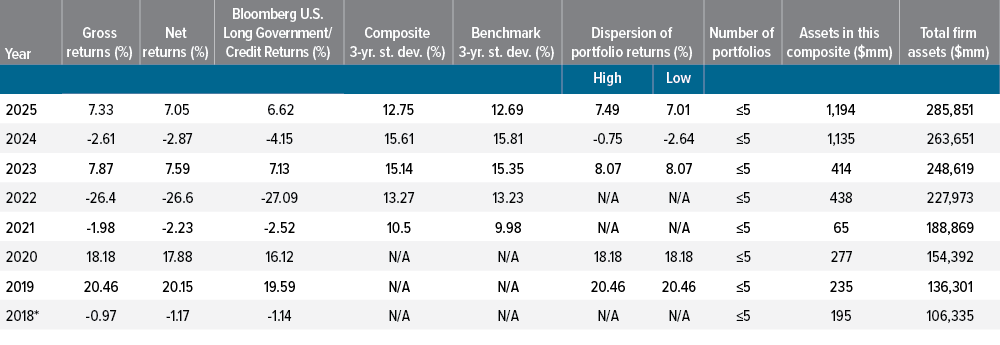
*Cumulative return for the period is from April 1, 2018 (inception of strategy) to December 31, 2019.
Voya Investment Management claims compliance with the Global Investment Performance Standards (GIPS®) and has prepared and presented this report in compliance with the GIPS Standards. Voya Investment Management has been independently verified for the periods January 1, 1996, through December 31, 2021. The verification report is available upon request. A firm that claims compliance with the GIPS standards must establish policies and procedures for complying with all the applicable requirements of the GIPS standards. Verification provides assurance on whether the firm’s policies and procedures related to composite and pooled fund maintenance, as well as the calculation, presentation, and distribution of performance, have been designed in compliance with the GIPS standards and have been implemented on a firmwide basis. Verification does not provide assurance on the accuracy of any specific performance report.
Notes
Firm definition:
Voya Investment Management (the “Firm”) is defined as all investment portfolios managed by Voya Investment Management Co. LLC and its subsidiary Voya Investment Trust Co. As of July 2022, Voya Investment Management acquired the investment personnel and assets from Allianz Global Investors.The total firm assets for 2022 are reflective of this acquisition.
Composite definition:
This is a fixed income strategy whose primary objective is to maximize total return mainly through security selection of long-dated corporate and treasury bonds, while maintaining duration similar to the portfolio’s index. Further, this strategy typically includes allocations to off-benchmark securities, including investment grade private credit and securitized assets. Portfolio valuations and returns for this composite are computed and stated in U.S. dollars. A $25 million minimum has been set for inclusion in the composite. This composite incepted and created on April 1, 2018.
Benchmark definition:
The Bloomberg U.S. Long Government/Credit represents the long component of the Bloomberg U.S. Government/Credit Index. The Bloomberg U.S. Long Government/ Credit Index includes treasuries (i.e., public obligations of the U.S. Treasury that have remaining maturities of more than one year) and agencies (i.e., publicly issued debt of U.S. Government agencies, quasi-federal corporations, and corporate or foreign debt guaranteed by the U.S. Government), and publicly issued U.S. corporate and foreign debentures and secured notes that meet specified maturity, liquidity, and quality requirements. Securities prices used to value the benchmark index for the purposes of calculating total return may or may not differ significantly from those used to value securities held within composite portfolios. both corporate and non-corporate sectors.
Treatment of fees & expenses:
Gross-of-fees returns are presented before management and custodial fees but after all trading expenses. Net-of-fees returns are calculated by deducting a hypothetical management fee from the gross return on a monthly basis and geometrically linking the results to produce annual returns shown. The hypothetical management fee is equal to the highest fee from any fee schedule offered at the time for the strategy shown. While fee schedules can change over time, any amended fee resulting from a change will not be retroactively applied to performance history, but will rather be applied on a prospective basis from the point of change. The annual management fee will vary according to the size of the account, and will depend on the type of investment vehicle selected. The current fee schedule for an institutional separate account is: 0.26% on the first $100 million; 0.23% on the next $200 million; 0.20% on the next $200 million; and 0.18% over $500 million. The current fee schedule for a Collective Investment Trust (CIT) is: 0.26% on the first $25 million; 0.23% on the next $50 million; and 0.20% over $75 million. Further information regarding applicable fee schedules is available upon request.
Explanation of risk measures:
“Dispersion of Portfolio Returns” presented for each annual period is based on gross-of-fees returns and is equal to the highest and lowest annual return among the portfolios that are included in the composite for the full year. If there is not at least 1 account that was in the composite for the entire year, then “N/A” will be displayed. “Composite 3-Yr St Dev” and “Benchmark 3-Yr St Dev” are rolling 3-year standard deviation calculations, which measure the variability of the gross-of-fee monthly performance returns for the composite and benchmark index return over the preceding 36-month period on an annualized basis. If the composite has not been in existence for at least 3 years as of a particular year-end then “N/A” will be displayed.
Other notes:
Performance includes the reinvestment of income. Policies for valuing investments, calculating performance, and preparing GIPS Reports are available upon request. A list and description of each composite and limited distribution pooled fund, as well as a list of broad distribution pooled funds, is also available upon request. Past performance is no guarantee of future results. GIPS® is a registered trademark of CFA Institute. CFA Institute does not endorse or promote this organization, nor does it warrant the accuracy or quality of the content contained herein.