LDI Quarterly Update: 1Q25

LDI Solutions Strategist

With the first quarter marked by volatility and funded status at risk, it may be time for defensive positioning.
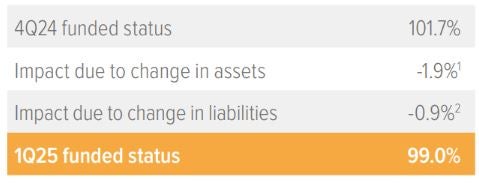
1 Growth asset return on the quarter was based on equity returns of -5%. Hedging assets, which match liability duration by design, showed a 1% return due to a slight decline in discount rate. After reflecting benefit payments, total net asset return is almost -2%.
2 Liabilities increased nearly 1% during the quarter due to a 10 bp decrease in rates, assuming plan duration of 11 years and accounting for service accruals and benefit payments.
As of 3/31/25. Source: S&P, FYE 2024 company reports, Voya IM calculations and 2025 estimates, and assuming a 50% / 50% split in growth and hedging assets.
In the Spotlight: When markets get grizzly
The first quarter of 2025 has seen heightened volatility and negative equity returns, with the threat of a bear market prompting many corporate pension sponsors to consider more defensive investment strategies. A key approach is increasing allocations to duration-matched fixed income, which reduces funded status volatility and enhances resilience. Even modest shifts—such as moving 20% from equities to fixed income—can significantly bolster funded status.
Recent history underscores the volatility mitigation benefits of credit in uncertain markets: during the 2020 Covid-19 crash, plans with higher fixed income allocations fared better (see Exhibit 1). In contrast, plans heavily weighted toward equities experienced significant funded status drops. Data shows that as plans increased fixed income allocations over time, funded status tended to both improve and stabilize.
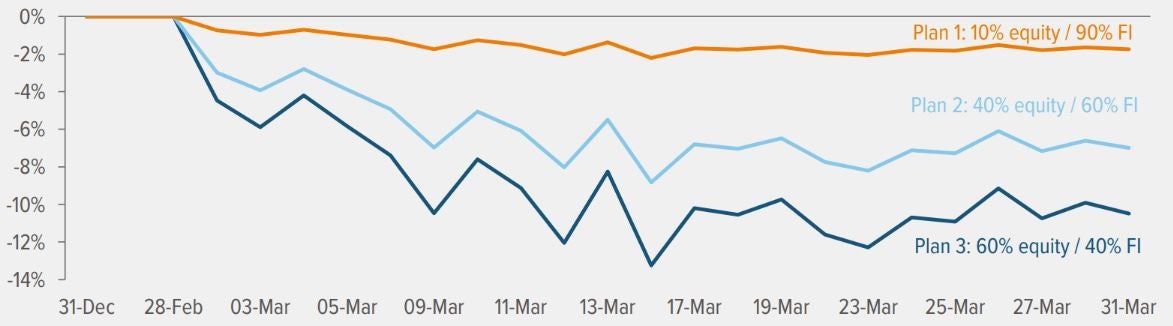
As of 03/31/20. Source: Voya IM calculations. Model assumes plans are 80% funded with a liability duration of 10 years, and all fixed income assets match the liability duration. For illustrative purposes only.
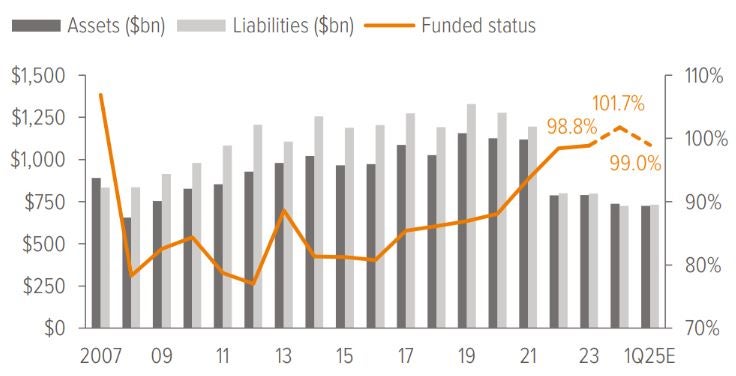
With today’s elevated yields—unseen since 2007— plans have a unique opportunity to lock in coupons comparable to expected equity returns, but with less risk. Sponsors can build a de-risked portfolio without sacrificing expected return on assets (EROA).
Beyond traditional investment grade fixed income, plans should diversify fixed income exposure to help mitigate concentration and credit risks. This includes investment grade private placements, commercial mortgage loans (CMLs), and securitized credit. These instruments offer higher spreads, structural enhancements, and diversification away from U.S. corporate credit cycles. Over $6 billion in liabilities have already been managed using such diversified strategies across major pension plans by Voya IM.
Hedging tools like Treasury futures, swaps, and swaptions can further help insulate plans from interest rate volatility, and are especially useful for underfunded plans lacking enough physical fixed income assets.
To help thrive in this uncertain environment, plans should implement robust liability-driven investing (LDI) strategies. Leaders like Voya offer innovative LDI approaches modeled on insurance best practices. By locking in yields, enhancing diversification, and hedging effectively, sponsors can stabilize funded positions and confidently navigate market challenges—helping to ensure their plans are as insulated as a bear in its den. For more details please read Voya’s timely paper on corporate pension investing in volatile markets: The Bear Necessities.
Notes on the first quarter of 2025
Discount rate decreased by 10 basis points, increasing liabilities modestly, while equities declined 5-10%. We estimate the funded status of extant pension plans in the S&P 500 decreased from 101.7% to 99.0% during the quarter. We assume a 50/50 growth assets and hedging assets, which is the average allocation for plans in the S&P 500. Equity returns year to date for the common mix of assets held by many sponsors was almost -3%, dragging down funded status.
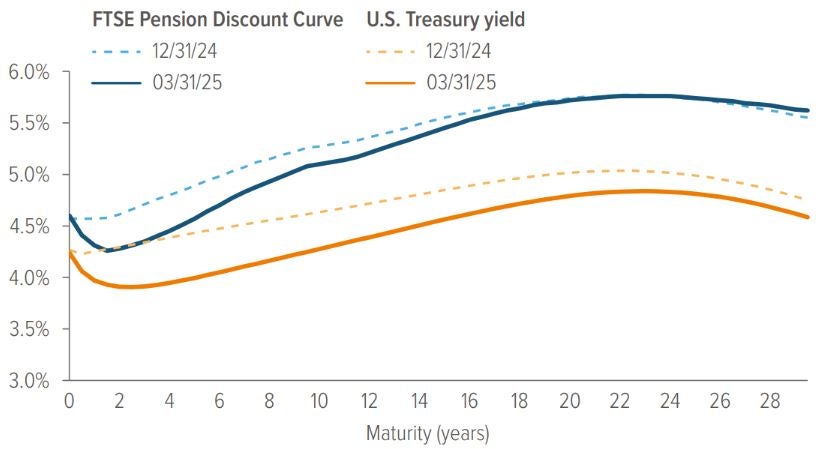
The Treasury curve steepened during Q1 due to lower short and intermediate rates. The 10yr UST finished the quarter lower by 30 bp while the 30 year UST was lower by almost 20 bp. This movement was primarily driven by market expectations of Federal Reserve interest rate cuts in response to signs of economic slowing and persistent inflationary pressures.
Corporate bond spreads widened due to growing fears of a recession fueled by new U.S. tariffs and escalating global trade tensions. These concerns led investors to shift toward safer assets, reducing demand for riskier corporate debt. As a result, spreads—especially in the high-yield (junk bond) space—rose sharply amid heightened market uncertainty. The long corporate index OAS ended the quarter 16 bp wider at 114 bp. The net result of rate and spread movements during the quarter was a 10 bp decrease in the FTSE Pension Discount Rate for short-duration plans. For a plan with a duration of 11 years, this translates to roughly a 1% increase in liabilities due primarily to changes in rates and, to a far lesser extent, spread widening.
Our representative equity portfolio had a total return of nearly -3%. For this purpose, we use a mix of S&P 500 (45%), Russell 2000 (25%), MSCI EAFE (20%) and MSCI EM (10%), reflecting the breadth of equity holdings in most plans.
- The US Treasury spot rate curve is flatter than the FTSE pension discount curve as of 3/31/2025.
- For the 15-year tenor, the U.S. Treasury spot rate is lower as of 3/31/2025 vs. 12/31/2024.
- Similarly, for the 15-year tenor, the Aa-rated corporate bond spot rate is lower as of 3/31/2025 vs. 12/31/2024.
Source: ICE Index Platform, FTSE pension discount curve.
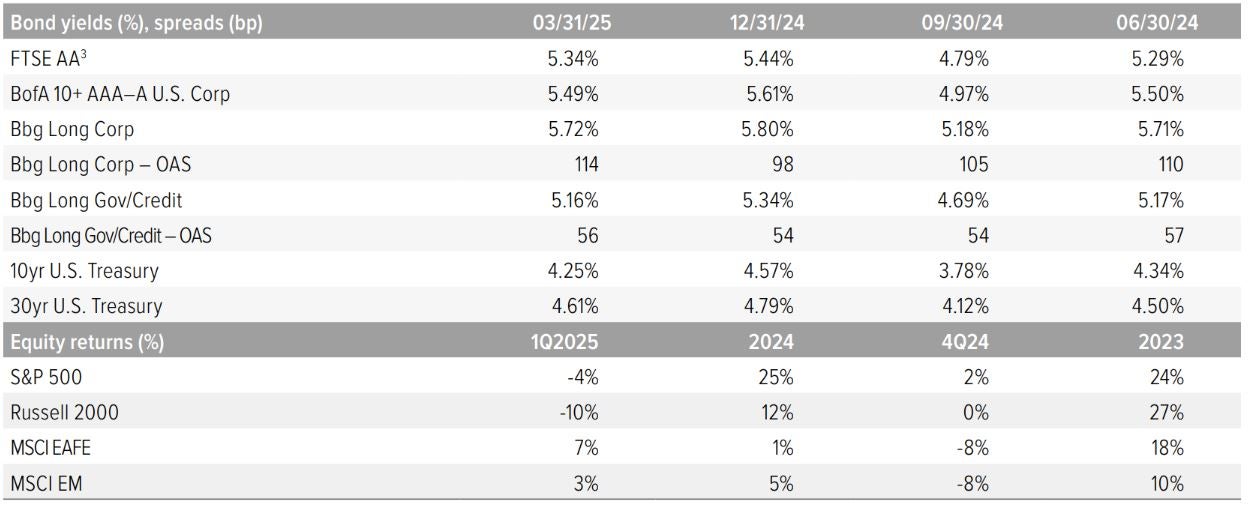
Source: FTSE, Barclays Live, ICE Index Platform, S&P, MSCI, Russell. See back page for index definitions.
3 Based on FTSE’s “short” duration plan, approximately 10.9 years.
A note about risk: Examples of LDI (liability-driven investing) performance included in this material are for illustrative purposes only. Liability valuations can increase due to falling interest rates or credit spreads, among other things, as the present value of future obligations increases with falling rates and falling spreads. Liabilities can also increase due to actual demographic experience differing from expected future experience assumed by the plan’s actuary. Diversification neither assures nor guarantees better absolute performance or relative performance versus a pension plan’s liabilities. In addition, investing in alternative investment products such as derivatives can increase the risk and volatility in an investment portfolio. Because investing involves risk to principal, positive results and the achievement of an investor’s goals are not guaranteed. There are no assurances that any investment strategy will be profitable on an absolute basis or relative to the pension plan’s liabilities. Information contained herein should not be construed as comprehensive investment advice. For comprehensive investment advice, please consult a financial professional.