Renewable Energy Infrastructure Debt: Q&A

Managing Director, Co-Head of Direct Infrastructure

Key Takeaways
Renewables have come a long way: Renewables represent a $60 billion-a-year financing opportunity, with strong demand from utilities and corporations.
It’s about economics and meeting power demand, not environmentalism: While renewable generation won’t be the only way utilities meet the rapid rise in U.S. electricity needs, it is arguably the fastest and easiest way.
Benefiting both red and blue: Red states, such as Texas, are some of the biggest producers (and thus beneficiaries) of renewable generation, and the IRA’s tax credit provisions enjoy bipartisan support. If IRA tax incentives are ended early, they may be replaced by cheaper senior debt—and any incremental cost increase would be passed on to the end consumers who are contracted to buy power.
Voya’s co-head of direct infrastructure lending recently spoke to Insurance AUM about the state of renewable generation in 2025. Here are the highlights.
Renewables have come a long way
You’ve been lending to energy transition projects for 20 years. How has the project and financing landscape evolved over the past decade?
Renewable energy has been one of the bright spots in the U.S. economy over the last couple of decades. Twenty years ago, renewables were an afterthought, contributing no meaningful generation. Now, they account for about 22% of our power (if you count hydro), and it’s a $60 billion-a-year financing marketplace.1
We’ve seen an evolution in capital providers and the types of capital available for these projects. It’s grown from traditional senior debt to tax equity monetization vehicles and preferred equity structures, as well as mezzanine and holding company (holdco) debt, which is where we operate most of the time.
Projects have gotten much bigger over time (Exhibit 1). It used to be that a large project was 10-20 megawatts (MW). Now, a large project is 500-700 MW. Capital requirements have grown alongside the size of the projects.
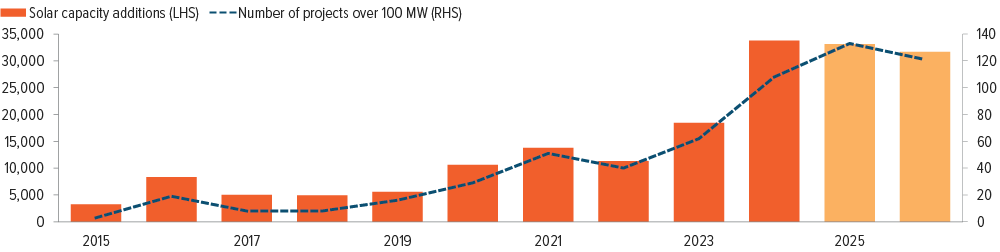
As of 02/11/25. Source: Energy Information Administration. 2025 and 2026 figures are forecasts.
And then it’s important to understand that the sector has continued to grow through a number of different cycles over the last 20 years: financial crises, interest rate cycles, the pandemic, different federal administrations (both Republican and Democrat), plus changes at the state level.
The reason the renewable energy industry kept growing and displacing fossil fuel is because it made economic sense (Exhibit 7). During that time, lenders learned a lot about the technology, whether it’s wind, solar, storage or anything else. We learned about reliability of the resources as well as other risks that are embedded in the projects—such as weather events that have affected projects, and insurance. We have had a lot of years to understand the risks.
We first started with only senior facilities, only at the project level. Now, people have gotten more comfortable with both holdco portfolio approaches and single-asset financings. The financing spreads for senior debt have come down over time, as people understood the risk better and better. Tax equity has been fairly stable over the years. For mezzanine holdco debt, it’s also stayed pretty stable. Equity has gone up and down, reflecting the various market cycles. But overall, it’s plentiful and it’s still available. Renewable generation in the U.S. has been a long journey, but it’s been a successful journey.
Why have projects gotten so much bigger?
Rising project size is a reflection of the increasing appetite of utilities and corporations for renewable power. That is a function of both overall electricity demand growth and state-level mandates. A majority of states either require utilities to source a percentage of their power from renewable generation (33 states) or have renewable generation goals (5 states).
Corporations—especially in tech—are also scrutinizing where their power comes from. If you think about it, it doesn’t make sense to power the AI revolution with coal, right? That would be weird. So there are several sources of demand for both electricity in general and renewable projects specifically. As we have more and more opportunity to sell this power, the projects grow (Exhibits 2-3)
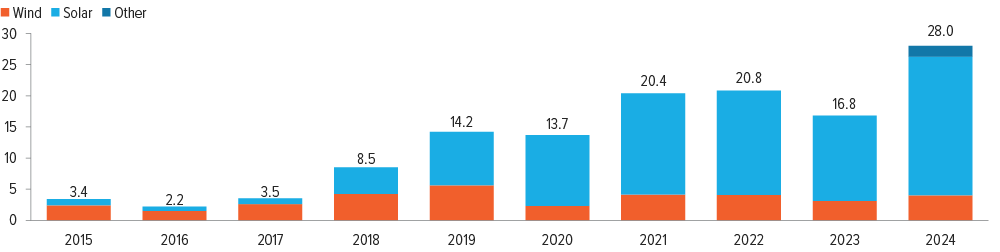
As of 02/20/25 Source: BloombergNEF.
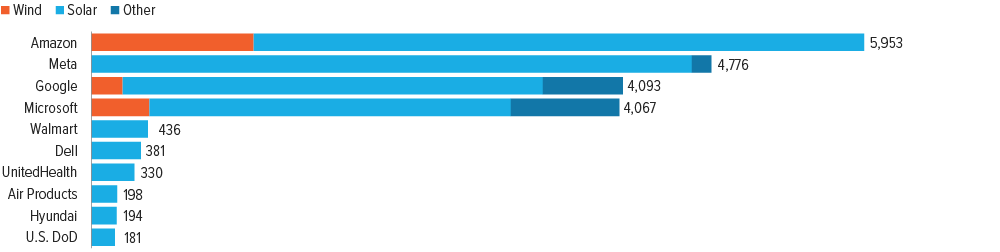
As of 02/20/25 Source: BloombergNEF.
It’s about economics and meeting power demand, not environmentalism
If I wanted to build a generation plant—either fossil fuel or renewable—how long would it take me to get it up and running?
It typically takes about two to four years, perhaps a bit less in some jurisdictions. Interconnection delays can elongate development times even further, particularly in congested states like California.
If you’re competent and experienced, you can still develop projects through their early stage with a manageable outlay of capital. First, you go and get your site control, and you do your fatal flaw analysis. You spend a relatively low amount of capital to understand whether you have a project that makes sense economically, doesn’t cause environmental problems, and can be built out and interconnected to the grid.
After that, the project enters a mid- to late-stage development cycle, where the developers start thinking about procurement: where they’re going to get equipment, who’s going to be building the project. They enter into conversations with the utilities about interconnection, and they’re going to have to put up interconnection deposits. They’re going to think about who they’re going to sell the power to and start negotiating power purchase agreements (PPAs).
That’s also when they’re going to need more capital. A lot of PPAs require cash collateral to be put up against this obligation to sell power, because buyers such as utilities count on it. And that’s when you make sure that there’s nothing that you haven’t really thought about as you go about permitting the project.
Finally, the project goes into a late stage, where the banks come in and provide senior debt financing and/ or tax equity commitments, and construction begins.
We typically come in at the later stages of the development cycle, after all the binary permitting risks have been addressed (Exhibit 4). We like taking a relatively small, calculated risk where we get a lot of pickup in terms of return, because capital at that stage is really precious for the developers—and very expensive. We’re one of the few providers able to fill that gap.
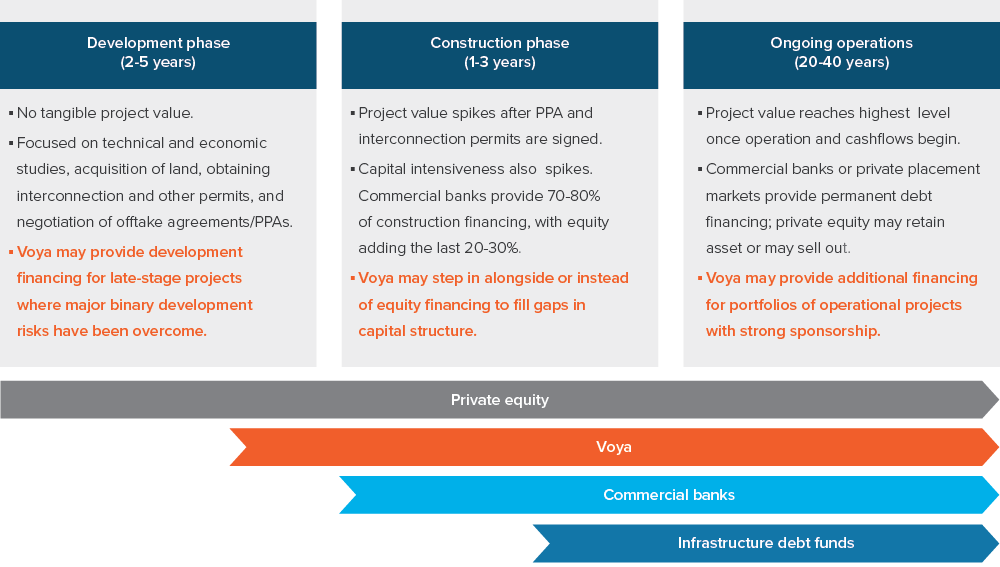
Source: Voya IM.
What does a fatal flaw analysis consist of?
A fatal flaw analysis is: Are you able to get enough land? Is it contiguous land? How are you going to interconnect your project to the grid? How much of an interconnection upgrade will you have to ask the utility to undertake in order to run transmission to the project location? Are you on land that may have environmental issues? Is the soil good enough? Before they spend any money, a good developer will undertake a long checklist of assessments to determine whether a particular site will be successful or not.
NERC2 recently upped its 10-year summer peak demand forecast by 50%. Where is that coming from, and how did utilities get caught on the back foot? It seems like it creates a tremendous amount of demand for this kind of a project.
Yes, everyone’s talking about that. Before we go into the projections, it’s important to understand how we got here. For the last 20 years, utilities have projected that U.S. electricity demand—load—will grow together with GDP, because they are generally correlated. It makes sense, right? To the extent that the economy grows, your electricity demand should grow as well.
But it didn’t really prove to be true, because along with the growth in GDP, we also had energy efficiency improvements that cut down on demand quite significantly. GDP growth and efficiency improvements essentially offset each other.3
So what happened? Utilities went to their regulators and asked to get an approval for new forms of generation based on GDP growth, and they were granted those approvals, but the load wasn’t there. And regulators felt that they had been hoodwinked into approving new power purchase agreements for demand that didn’t materialize.
As a result, the industry got caught completely flat-footed by the AI revolution and the accompanying data center buildout. If you tune into pretty much any utility earnings call out there, you’ll hear talk about being short generation capacity, and utilities asking themselves, “How do we address this expected load growth that’s coming down our way from all of this data center and AI revolution?”4 There’s a lot of hype around data centers, and of course we’re going to get more energy efficient when it comes to AI. But even so, the data tell us that it’s still going to be a compelling story, in terms of U.S. power demand growth (Exhibit 5).
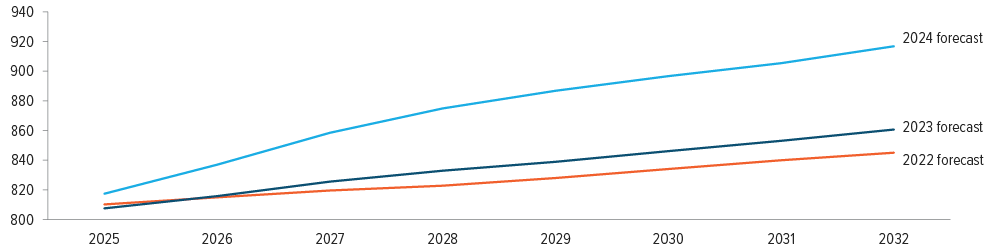
As of 02/21/25. Source: NERC, Voya IM.
Data centers are only part of the story, though. Bitcoin and electric vehicles are also creating new demand, in some areas more than others. But the other big part of the story is onshoring of manufacturing and industry. To the extent that manufacturing comes back onshore, we are going to need more and more power in this country. And when a developer is planning a manufacturing facility or data center, the first question they ask is, “Where am I going to get power?” That’s where we as an industry have to think about electricity needs and plan for this new era.
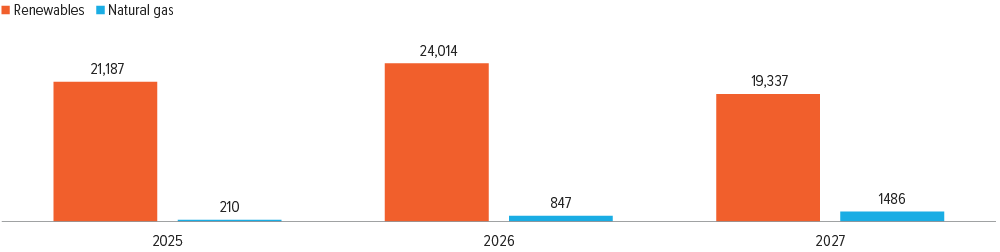
Despite a lot of rhetoric out there, renewables are the most viable place to source this power. As a result of the Inflation Reduction Act (IRA), we have a tremendous pipeline of solar, wind, hybrid and other renewable projects coming online in places where we need generation in the next few years.5 And they’re ready to go, so to speak. They’re shovel-ready or they’re close to shovel-ready, so they’re low-hanging fruit.
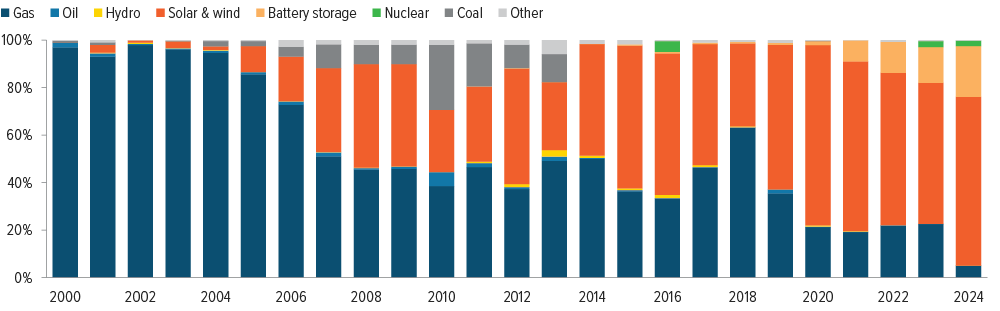
As of 02/21/25. Source: Energy Information Administration, Voya IM.
Now, it makes limited sense to answer this power demand issue only with renewables. We can certainly build out more gas generation, but that isn’t expected to make a meaningful impact until at least 2030.6 Natural gas generation is going to be a growing industry, but it will take quite a bit of time to come back and for plants to be built and begin supplying electricity. We can also consider nuclear, but it takes 10 years to develop a new nuclear power plant. We have built only one or two over the course of the last 20 years. It is really difficult to do. And of course you can stop decommissioning old coal-fired plants, which are expensive to operate and reaching obsolescence—the average age of a coal plant in this country is 35 years. You can also stop decommissioning old natural gas plants. Maybe that will be one of the answers. But overall, if you look at what we need, when we need it, and where it can come from, renewables already are—and will continue to be—a large part of that solution (Exhibit 6).
Benefiting both red and blue
Are you hearing anything about renewable projects being postponed or canceled by the developers in light of President Trump’s raft of executive orders freezing grants and distributions?
With the exception of offshore wind projects, we have not seen any projects being delayed, postponed or otherwise affected yet. We deal mostly with projects that are financed by banks and private institutions, not projects that get federal loan guarantees. I imagine the federal loan guarantee projects could be affected, but we have not seen it with the projects we focus on.
At the end of last year, we saw a number of project portfolios come to market looking for buyers. That’s a fairly natural shift of risk allocation. There’s a healthy M&A market, and prices are holding up—in fact, we had one of our best exits yet from such M&A earlier this year. I don’t see any fire sales; I don’t see any kind of distressed buying. In part, that’s because there’s a very deep market that wants to own generation in the U.S., and it’s composed of both domestic and foreign buyers. Everybody who I talk to, none of us are seeing any slowdown in that trend. Again, early days, but we have not seen any effects so far.
If the IRA’s tax credits go away, how does that affect the economics of the renewable generation space?
This is an area we’re very familiar with as investors. We’ve had tax incentives in this sector for 20 years, and knowing how to qualify for them is a core part of any experienced developer’s or investor’s skill set.
The short answer is that the increased availability of cheaper debt, together with rising power purchase agreement prices, should make up for the loss of tax credits.
The long answer is that the IRA was one of the most powerful environmental legislations passed in this country, certainly in our lifetime and probably ever. It provided visibility for the tax portion of these projects and provided a subsidy tax component of the capital structure of these projects for a number of years, up until 2030.
But keep in mind that because the IRA is a legislative act, It would take another legislative act to stop those tax credits. I’m not sure such an act would have support in the House or the Senate, because a number of Republican legislators like the IRA and have been vocal in their support of it. Even if it were repealed, projects that were already under construction or had qualified for the start of construction under IRS rules should not be affected.
If we lose those tax credits when they expire in 2030, or earlier due to a legislative act, the power purchase agreements will adjust and the power prices will go up.
The tax component of these projects essentially subsidize rate payers at the expense of the taxpayers. If you stop the tax incentives, the end consumer, whether it’s a corporation or a residential user, will have to pay more for power, and the projects will have more cash available to lend against.
Typically, senior debt is the cheapest part of the financing structure here. Tax equity is the most expensive. To the extent that you replace tax equity with cheaper senior debt capital, it will actually improve projects’ balance sheets.
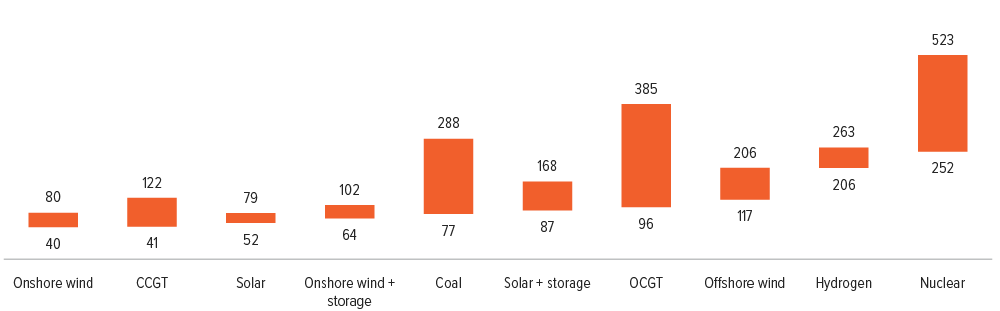
As of 02/20/25. Source: BloombergNEF. CCGT stands for combined cycle gas turbine, which is baseload natural gas. OGCT is open cycle natural gas turbine, which is flexible/peaking power. The higher ends of CCGT, coal, and OGCT cost scales represent plants that utilize carbon capture/sequestration.
How did renewable generation do under Trump’s first term? Did it grow?
Renewables had a tremendous four years under the first Trump administration (Exhibit 8).
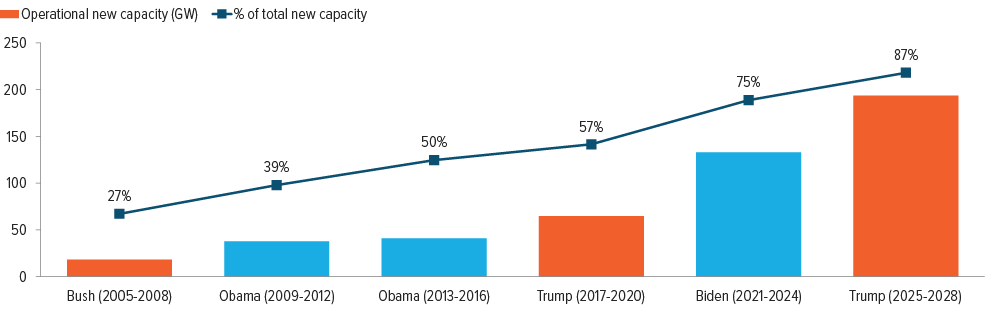
As of 02/11/25. Source: Energy Information Administration. 2025-2028 numbers are projects’ planned operation years as reported in form EIA-860M.
You recently had a successful exit from a portfolio of generation assets in Virginia, West Virginia and Arizona, and you’ve also invested in several successful projects in Texas. Those are some pretty red states. Is it true what they say about Republican-leaning states being big beneficiaries of renewable energy?
The IRA was a $400 billion piece of legislation. 92% of its benefit went to red states. Texas is the largest solar and wind market in the country—it took the baton from California—and it’s a tribute to how easy it is to get projects permitted and built there (Exhibit 9). The second-largest market is Oklahoma; it’s a wind market. Iowa is right up there. So is Arizona, Indiana, Montana.6
Climate change is obviously a highly partisan issue, but renewable generation has broad-based support in both blue states and red states. Let me give you an example: In August, 18 Republican members of the House wrote a letter specifically expressing their support for the IRA’s energy tax credits and the many benefits they’ve seen from those credits in their home states. Many red states have renewable portfolio standard (RPS) mandates, where utilities are required by the state legislators to source a certain percentage of power from renewables.
We feel pretty good about the overall political climate, when it comes to support for renewables. Obviously, anything can happen. We’ll see what the next four years bring, but historically, renewables have enjoyed bipartisan support.
As of 02/11/25. Source: Energy Information Administration.
A note about risk
The principal risks are generally those attributable to bond investing. Holdings are subject to market, issuer, credit, prepayment, extension and other risks, and their values may fluctuate. Market risk is the risk that securities may decline in value due to factors affecting the securities markets or particular industries. Issuer risk is the risk that the value of a security may decline for reasons specific to the issuer, such as changes in its financial condition.