
Oleg Gershkovich, A.S.A., M.A.A.A.
LDI Solutions Strategist

Brett Cornwell, CFA
Client Portfolio Manager, Fixed Income
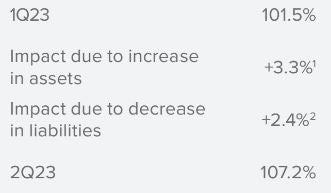
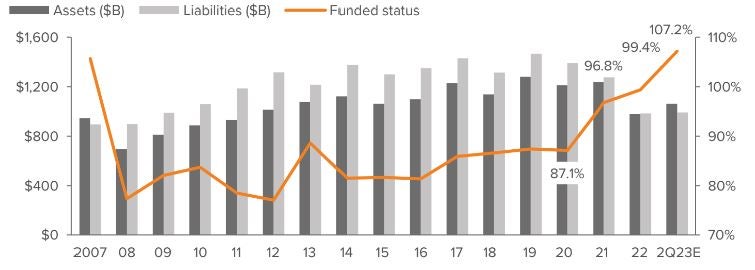
Funded status for U.S. pension plans improved in 2Q by over five percentage points, from 102% in 1Q to107% — the highest level since 2007.
- Funded status for U.S. pension plans improved in 2Q by over five percentage points, from 102% in 1Q to107% — the highest level since 2007.
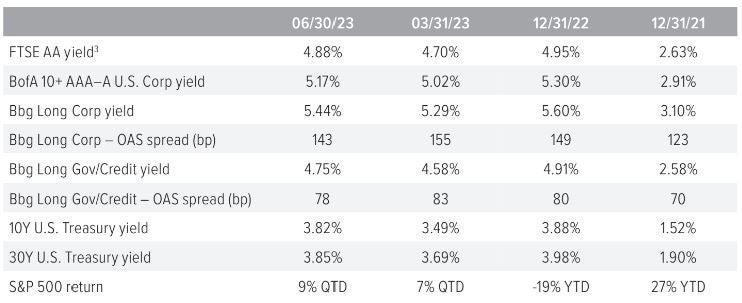
- The curve inverted a touch more, with the 10Y UST and 30YUST increasing 33 bp and 16 prospectively, on the quarter.
- Credit spreads narrowed slightly. The net result of rate and spread changes was a 20 bp increase in the discount rate. For a plan with a duration of12 years, this translates to a 2.4%decrease in liability.
- The S&P 500 had a total return of nearly 9% for the quarter, further contributing to the funded status improvement.
- Pension risk transfers print new mega deal: AT&T announced an $8.1B transfer in May, the third-largest in buyout history after GM’s $26B deal in 2012 and IBMs' $16B transaction in 2022. As buyouts occur, a residual plan’s liability profile changes, warranting a review of the plan’s asset allocation, especially given higher rates across fixed income.
Source: Voya IM calculations, FTSE, S&P.
1 Growth assets based on S&P 500 return of 8.7%; hedging assets (which match liability duration) had a 2.4% loss, similar to liabilities, by design.
2 Liabilities declined 2.4% due to 20 bp increase in rates and plan duration of 12 years.
As of 06/30/23. Source: Milliman, S&P, 10-K data, Voya IM.
Source: FTSE, Barclays Live, ICE Index Platform, S&P. 3) See back page for index definitions.
3Based on FTSE’s “short” duration plan, approximately 11 years.
Source: ICE Index Platform, FTSE pension discount curve.
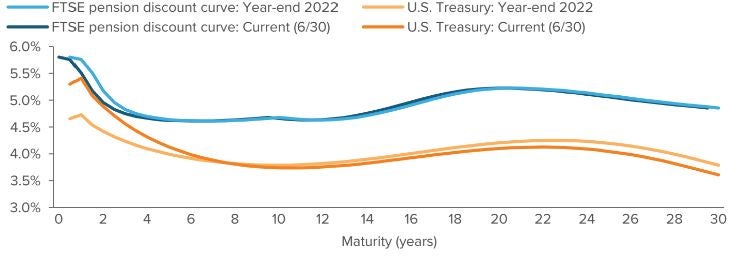
- The U.S. Treasury spot rate curve is more inverted than the FTSE pension discount curve as of 06/30/23.
- For the 15-year tenor, the UST spot rate is lower as of 06/30/23 versus 12/31/22.
- Similarly, for the 15-year tenor, the AA rated corporate bond spot rate is lower as of06/30/23 versus 12/31/22.
A note about risk Examples of LDI (liability-driven investing) performance included in this material are for illustrative purposes only. Liability valuations can increase due to falling interest rates or credit spreads, among other things, as the present value of future obligations increases with falling rates and falling spreads. Liabilities can also increase due to actual demographic experience differing from expected future experience assumed by the plan’s actuary. Diversification neither assures nor guarantees better absolute performance or relative performance versus a pension plan’s liabilities. In addition, investing in alternative investment products such as derivatives can increase the risk and volatility in an investment portfolio. Because investing involves risk to principal, positive results and the achievement of an investor’s goals are not guaranteed. There are no assurances that any investment strategy will be profitable on an absolute basis or relative to the pension plan’s liabilities. Information contained herein should not be construed as comprehensive investment advice. For comprehensive investment advice, please consult a financial professional. |