LDI Annual Review: 2023

LDI Annual Review: 2023

Time to read: Minutes
Funded status evolution of U.S. pension plans
Illustration for a 50/50 fixed income/equity portfolio with a duration of 12

As of 12/31/23. Source: S&P, FYE 2022 company reports, Voya IM calculations and 2023 estimates.
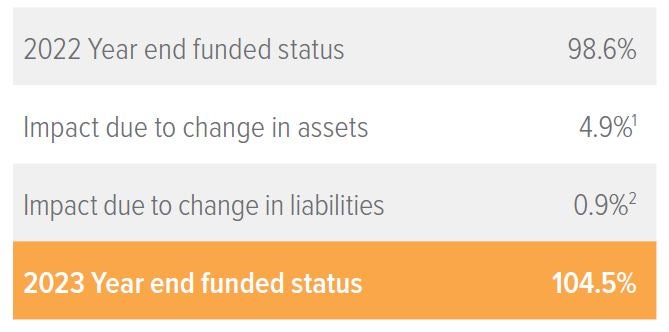
1 Growth assets based on S&P 500 return of 26%; hedging assets (which match liability duration) had a 2% gain, similar to liabilities, by design, also reflecting benefit payments.
2 Liabilities increased 2% due to 19 bp decrease in rates and plan duration of 12 years, further adjusted for service accruals and benefits payments.

1

As of 12/31/23. Source: S&P, FYE 2022 company reports, Voya IM calculations and 2023 estimates.

Notes on the quarter

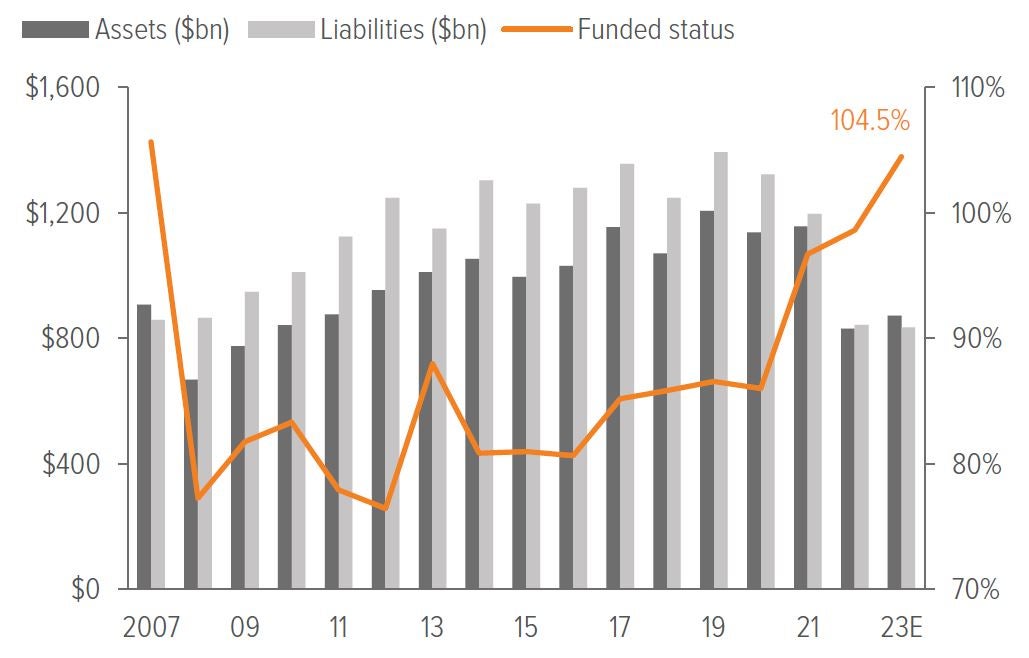
  • A third consecutive year of improved funded status for U.S. pension plans. Plans are 105% funded, in aggregate, up from 99% the year before—and their highest funded level since the GFC.
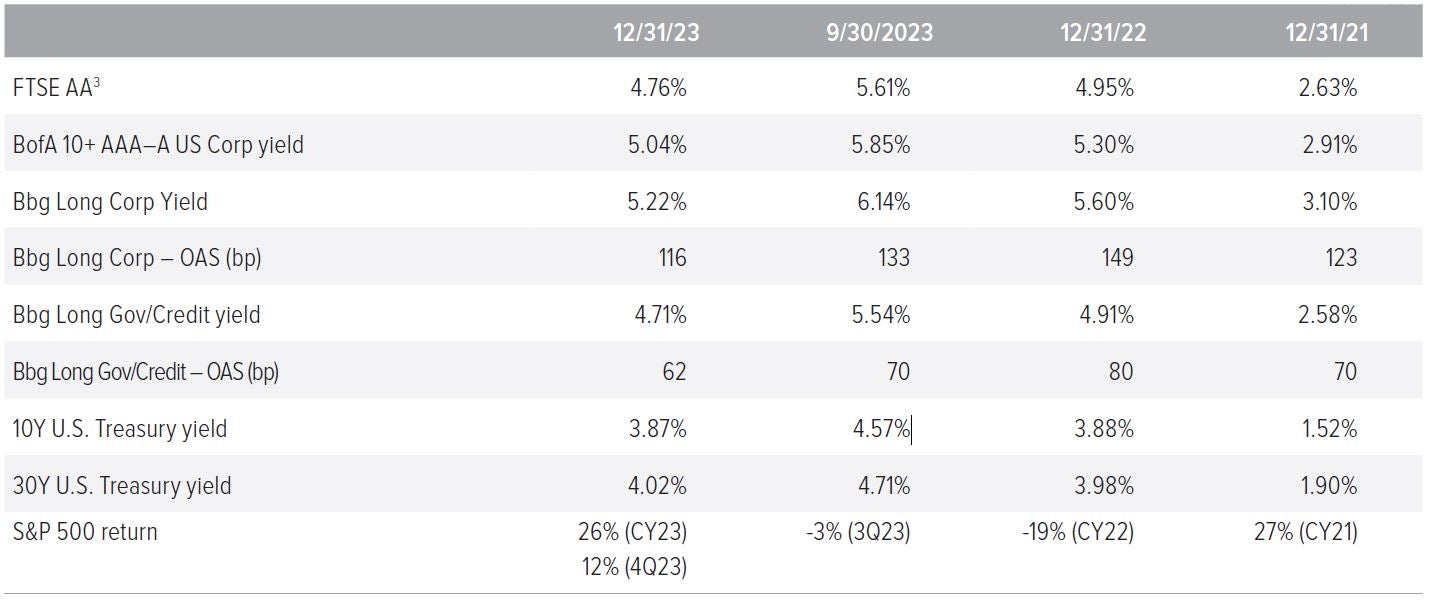
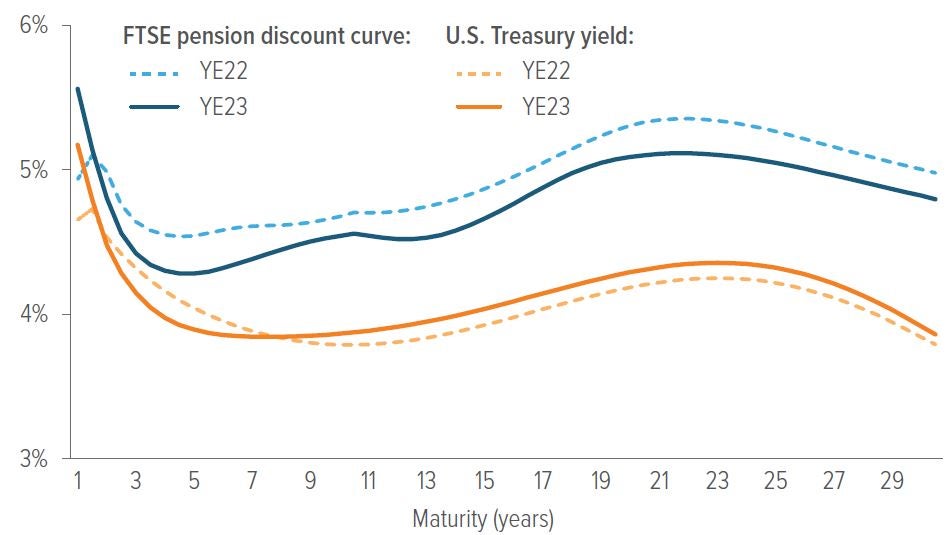
  • The treasury curve was largely unchanged in 2023, with the 10yr UST making a round trip, finishing 1 bp lower than a year ago, the 30yr UST increasing a mere 3 bp, and a mostly parallel shift lower during Q4.
  • Credit spreads narrowed even more. The net result was a decrease in the discount rate of 19 bp on the year, most of it from a fall of 85 bp in Q4. For a plan with a duration of 12, this translates to a 2% increase in liability during 2023. However, this was more than offset by a release from liabilities through benefit payments that were twice as large as the service accrued during the year.
  • U.S. equities had total returns of 26% for the year and 11% for the quarter, significantly contributing to the improved funded position.

In the spotlight: Harbinger or anomaly? IBM re-opens its pension plan.

IBM’s decision to re-ignite accruals in its DB plan comes on the heels of several consecutive years of surplus. In 2022, this was significantly aided by a $16bn annuitization, the second largest on record. That annuitization alone contributed 7% of the plan’s 9% improvement in funded status that year, causing it to finish 2022 at 117%. (Typically, an annuitization further improves an overfunded plan’s ratio.)

Most sponsors with such a surplus would pursue a full plan termination, but not IBM. In an act perhaps as opportunistic as it is paternalistic IBM re-opened its DB plan, injecting diversification for participants and reducing the investment risk they bear. This was done with the added elegance of the DB accrual functioning as a “swap” for the DC contribution. We applaud a thaw in DB pensions and believe that, with a fully-hedged program and a diversified portfolio, the pension headaches of past decades can largely be avoided.

Markets
Markets

Source: FTSE, Barclays Live, ICE Index Platform, S&P. 3) See back page for index definitions.

3 Based on FTSE’s “short” duration plan, approximately 11.4 years.

Spot rate curves
Spot rate curves
  • The U.S. Treasury spot rate curve is flatter than the FTSE pension discount curve as of 12/31/2023.
  • For the 15-year tenor, the U.S. Treasury spot rate is higher as of 12/31/2023 versus 12/31/2022.
  • However, for the 15-year tenor, the AA-rated corporate bond spot rate is lower as of 12/31/2023 versus 12/31/2022.

The year ahead: Which way will rates go is anyone’s guess. Is the Fed poised to turn the corner? Perhaps. Many are pricing in rate declines, which would deteriorate funded status for unhedged plans. Uncertainty continues to pervade markets around factors such as inflation, recession, elections, and global conflicts. Yet most plan sponsors are starting the year at a funded level not seen since 2007. The only infallible approach here is to secure funded positions by de-risking and diversifying portfolios. Always be de-risking.


A note about risk

Examples of LDI (liability-driven investing) performance included in this material are for illustrative purposes only. Liability valuations can increase due to falling interest rates or credit spreads, among other things, as the present value of future obligations increases with falling rates and falling spreads. Liabilities can also increase due to actual demographic experience differing from expected future experience assumed by the plan’s actuary. Diversification neither assures nor guarantees better absolute performance or relative performance versus a pension plan’s liabilities. In addition, investing in alternative investment products such as derivatives can increase the risk and volatility in an investment portfolio. Because investing involves risk to principal, positive results and the achievement of an investor’s goals are not guaranteed. There are no assurances that any investment strategy will be profitable on an absolute basis or relative to the pension plan’s liabilities. Information contained herein should not be construed as comprehensive investment advice. For comprehensive investment advice, please consult a financial professional.

3318636

Past performance is no guarantee of future results. This information is proprietary and cannot be reproduced or distributed. Certain information may be received from sources Voya Investment Management considers reliable; Voya IM does not represent that such information is accurate or complete. Certain statements contained herein may constitute “projections,” “forecasts” and other “forward-looking statements” which do not reflect actual results and are based primarily upon applying retroactively a hypothetical set of assumptions to certain historical financial data. Actual results, performance or events may differ materially from those in such statements. Any opinions, projections, forecasts and forward looking statements presented herein are valid only as of the date of this document and are subject to change. Nothing contained herein should be construed as (i) an offer to buy any security or (ii) a recommendation as to the advisability of investing in, purchasing or selling any security. Voya IM assumes no obligation to update any forward-looking information.

The opinions, views and information expressed in this presentation regarding holdings are subject to change without notice. The information provided regarding holdings is not a recommendation to buy or sell any security. Portfolio holdings are fluid and are subject to daily change based on market conditions and other factors.

Index definitions

Index returns do not reflect fees, brokerage commissions, taxes or other expenses of investing. Investors cannot invest directly in an index. The FTSE Pension Liability

Index reflects the discount rate that can be used to value liabilities for GAAP reporting purposes. Created in 1994, it is a trusted source for plan sponsors and actuaries to value defined-benefit pension liabilities in compliance with the SEC’s and FASB’s requirements on the establishment of a discount rate. The index also provides an investment performance benchmark for asset-liability management. By monitoring the index’s returns over time, investors can gauge changes in the value of pension liabilities. The ICE BofA AAA-A U.S. Corporate Index is a subset of the ICE BofA U.S. Corporate Master Index, which tracks the performance of USD-denominated investment grade rated corporate debt publicly issued in the U.S. domestic market. This subset includes all securities with a given investment grade rating of AAA through A. The Bloomberg U.S. Long Credit Index represents the long component of the Bloomberg U.S. Credit Index, which includes publicly issued U.S. corporate and specified foreign debentures and secured notes that meet specified maturity, liquidity and quality requirements. The Bloomberg U.S. Long Government/Credit Index represents the long component of the Bloomberg U.S. Government/Credit Index, which includes Treasuries, agencies and publicly issued U.S. corporate and foreign debentures and secured notes that meet specified maturity, liquidity and quality requirements. The S&P 500 Index consists of approximately 500 leading U.S. companies with approximately 75% coverage of the U.S. stock market capitalization.

Canada: This document is private and confidential and only for use by “permitted clients” in Canada. This document is for information purposes only and is not intended as an offer or solicitation to invest. This document does not constitute investment advice and should not be relied upon as such. In addition, please be advised that Voya Investment Management is a non-Canadian company. We are not registered as a dealer or adviser under Canadian securities legislation. Voya Alternative Asset Management LLC operates in the Provinces of Ontario and Quebec based on the international adviser registration exemption provided in National Instrument 31-103. Voya Investments Distributor, LLC operates in the Provinces of Alberta, British Columbia, Quebec, Manitoba, Ontario and Saskatchewan based

on the international dealer registration exemption provided in National Instrument 31-103. As such, investors will have more limited rights and recourse than if the investment manager or broker-dealer were registered under applicable Canadian securities laws.

For qualified institutional investor use only. Not for inspection by, distribution to or quotation to the general public.

Top