The following are historical insights based on market conditions at a point in time. Any forward-looking statements contained herein are based on information at the time. Current views, performance and portfolio information may differ materially from those expressed or implied in such statements. Voya IM makes no representation that past publications will be updated.
June’s decline in funded ratios reinforced the need for pension plan sponsors to de-risk portfolios through higher fixed income allocations. We see a lot to like in intermediate corporates, high-quality private placements and securitized credit.
Highlights
- De-risking would have benefited plans in 1H22: Acceleration in pension funded ratios reversed course in June 2022, eroding progress achieved earlier in the year and even giving back some of 2021 improvements. Sponsors who took advantage of improvements in 2021 to lock in gains likely experienced much less degradation in funded status than those who stayed the course. The lesson from June is that the merits of de-risking remain.
- Shifting to intermediate bonds and diversifiers: Economic uncertainty and higher rates have removed some popular approaches from the sponsor playbook. We believe long corporates may offer inexpensive buys for pension plans to match durations across the curve, while intermediate credit offers a host of seductive qualities. Meanwhile, intense focus on diversification has driven adoption of new asset classes in LDI, including private placements, CMLs, agency CMOs and other securitized credit instruments.
- Taking care with annuitizations: Despite their appeal, annuitizations may not be the most prudent solution for every sponsor. Consideration must be given to the potential impact on collateral and hedging, settlement accounting and residual plan maintenance.
Sponsors were set up nicely for 2022—then came June
By the end of 2021, corporate pension plans were in their strongest shape in more than a decade. Of the 146 companies in the S&P 500 with a defined benefit plan (the “S&P pension plans”), aggregate funded status had reached 97%, breaking through 90% for the first time since before the financial crisis (Fig. 1). Viewed differently, almost three-quarters of the companies in our study were more than 90% funded, up from half at the end of 2020 (Fig. 2).
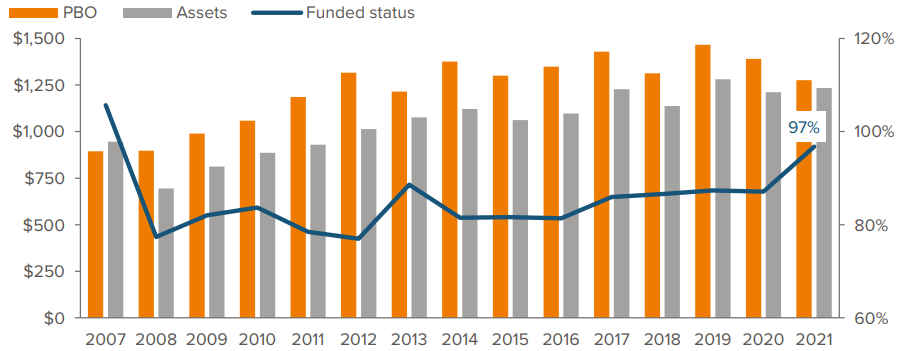
As of 12/31/21. Source: Company reports, Bloomberg, Voya Investment Management. Based on the 10-K data of 146 S&P 500 companies (referred to hereafter as “S&P pension plans”) that a) maintain a defined benefit pension plan, b) have a December fiscal year, and c) offer consistent historical data back to 2007.
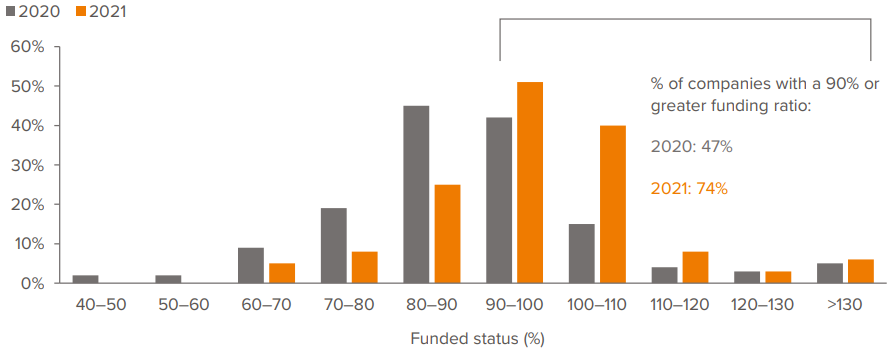
As of 12/31/21. Source: Company reports, Bloomberg, Voya Investment Management. Analysis aggregates year-over-year assets and benefit obligations from all studied plans to obtain yearly funded status. See Exhibit 1 footnote for S&P pension plan definition. Past performance is no guarantee of future results.
Things continued along well in 2022. Plans were improving upon an already record-breaking 2021 year, eking out an additional 2–4% improvement in funded status in just five months, on top of the 10% achieved in 2021. Amid the market downturn, declining liability values due to higher rates were offsetting asset losses. In February, we noted “Lock in gains, focus on de-risking.” In April: “De-risking: If not now, when?”
Then June brought an inflection point. Pension plans that hadn’t de-risked were dragged into a Groundhog Day scenario of callous volatility. The S&P’s 8.4% decline—without an offsetting rise in rates—eroded all the acceleration in funded status, darkening the silver linings to which sponsors had steadfastly clung. The result was a 2–3% decline in funded status from the beginning of the year through June. Figure 3 approximates the preservation of funded status for different equity and fixed income allocations made at year-end 2021.
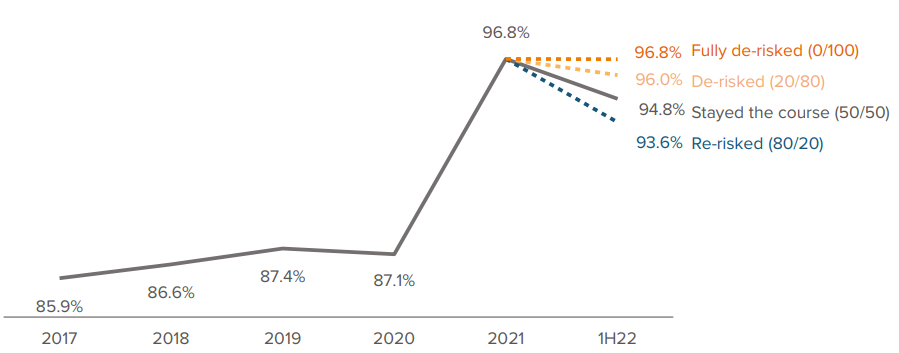
As of 06/30/22. Source: Company reports, Bloomberg, Voya Investment Management estimates. Expected funded status level based on risk profile and realized market returns. See Exhibit 1 footnote for S&P pension plan definition. Past performance is no guarantee of future results.
Catching the de-risking wave
Looking back to 2021, the industry was abuzz with glide paths breaching multiple times and ALMs re-evaluating—and re-evaluating again—asset mixes, hedge ratios and overlays. Funding ratios were almost too good, and sponsors raced to keep up, solidifying their gains by shifting to fixed income. In our study group of 146 S&P companies, the average fixed income allocation increased to 48%—a remarkable shift from the sub-40% weightings commonly observed over the past decade (Fig. 4). Meanwhile, the number of companies with over 50% in fixed income increased from 36% to 47%, underscoring an overarching trend of de-risking.
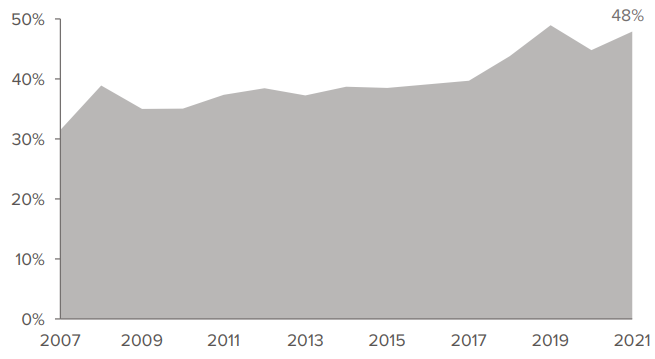
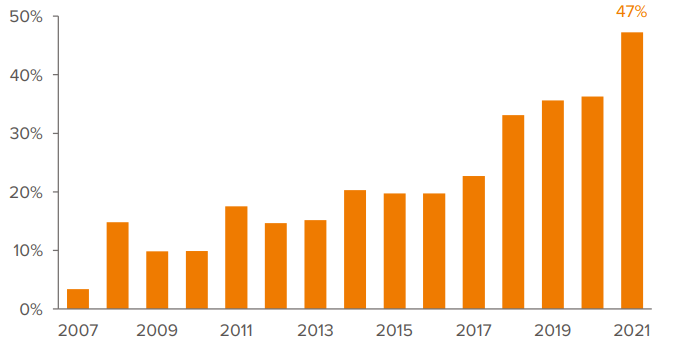
As of 12/31/21. Source: Bloomberg, Voya Investment Management. Based on 10-K data of 146 of S&P 500 companies that maintain a defined benefit pension plan and have a December fiscal year end with consistent historical data back to 2007. See Exhibit 1 footnote for S&P pension plan definition.
Unsurprisingly, contributions in our study group declined, as improved funded positions relieved sponsors of both required contributions and their planned discretionary contributions (Fig. 5). Furthermore, pensions tend to experience lower service costs as corporations discontinue plan accruals or close plans to new entrants. Note that plans contributed just over $500 billion, or 50% of their average asset size, since the global financial crisis—a warning to de-risk and lock in gains in case there is a repeat of falling rates eroding funded status positions.
We know anecdotally that the rotation to fixed income continued into 2022. While we don’t yet know in aggregate the changes sponsors made to their pension programs, the merits of de-risking remain evident.
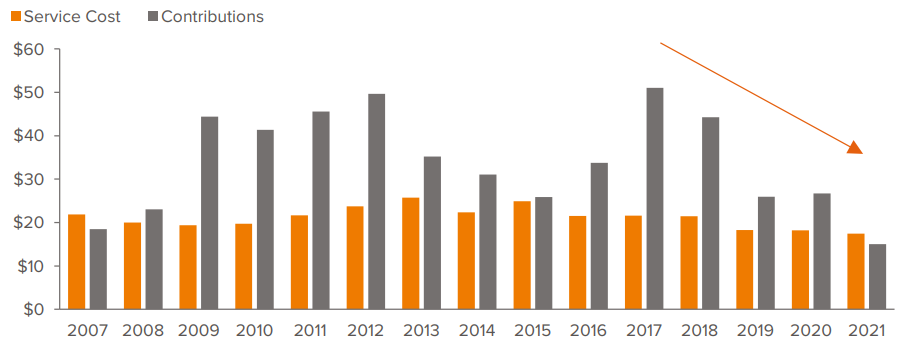
As of 12/31/21. Source: Company reports, Bloomberg, Voya Investment Management. See Exhibit 1 footnote for S&P pension plan definition.
Economic quagmire and recession specter
It’s hard to overstate the magnitude of current economic uncertainty. At times, it feels like we are witnessing an economic meltdown in slow motion, paralyzed by conflicting economic data points: low unemployment coupled with near-double-digit inflation prints, pent-up savings that spark spending sprees despite pain at the pump and at the grocer, post-pandemic revenge travel and war.
Uneasy questions abound. The biggest of all is whether the Federal Reserve will be able to steer a soft landing or if it will trigger a recession. As quantitative tightening and rate hikes envelop the economy, the ensuing increased borrowing costs could wither economic prospects. Indeed, the Fed is burdened with the unenviable task of unwinding history’s greatest monetary experiment, rivaled only by Rome’s debasement of silver in denarii. In short, the future is as precarious as ever.
For pension sponsors, options are narrowing. The reprieve of 2021 and early 2022 was short lived. An equity rout was years in the making, and sponsors’ recent pivot, after a last gasp from equities, was sensible. Then, during the first half of 2022, rates sold off, and spreads widened with ominous curve inversions. Moreover, the negative correlation between bonds and stocks evaporated as inflation remained elevated (Fig. 6).
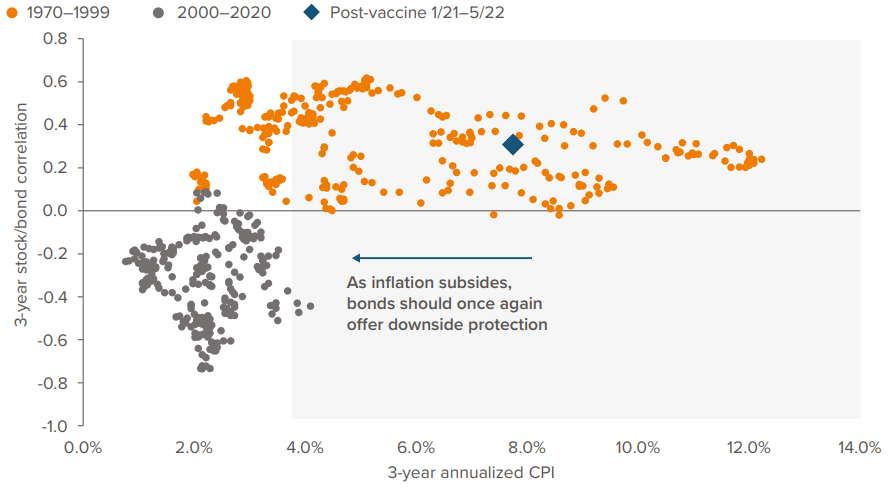
At 05/31/22. Source: Bureau of Labor Statistics, Standard & Poor’s, Federal Reserve, Voya Investment Management. Stocks: S&P 500. Bonds: 10Y Treasury. 3Y annualized CPI represented by the U.S. CPI Urban Consumers NSA. Past performance is no guarantee of future results.
For total return investors, the “flight to quality” has broken down under this paradigm and is no longer in their playbook. But for sponsors, long-duration bonds are viewed differently. Pension promises are bond promises, so investments in long bonds are a natural hedge and will continue to be a useful foundation in the increasing fixed income allocation. In fact, the decline in the investment grade long corporate sector during 2022 has created inexpensive buys for pension plans, allowing them to button up their duration matches across the curve with more yield for less risk (Fig. 7). This should help them meet their EROA targets and reduce pension expenses.
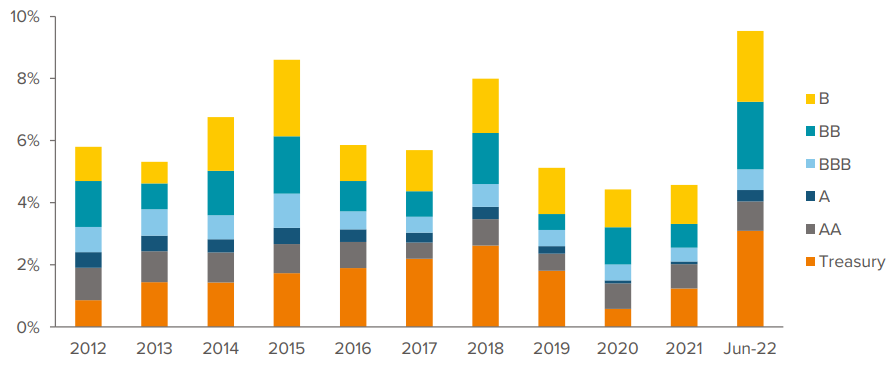
As of 06/30/22. Source: Bloomberg Index Services Limited, Voya Investment Management. Treasury: Bloomberg U.S. Treasury Index. Yields by credit quality: Bloomberg U.S. Corporate Aa, A and Baa (BBB) subindices and Bloomberg U.S. High Yield Corporate 2% Issuer Cap Ba (BB) and B subindices. Past performance is no guarantee of future results.
The recent rate rise may sunset certain sponsors’ beloved gambits, such as borrow-to-fund strategies in which sponsors issue corporate debt and use the proceeds to extinguish pension debt. In these cases, plan sponsors get a tax deduction on contributions to the pension plan and, when rates are lower than the PBGC variable-rate premium, effectively pay off expensive debt with cheaper debt. But now that borrowing rates are edging higher than the PBGC variable-rate premium—currently 4.8% for 2022, with future increases indexed to the National Average Wage—these strategies are no longer viable and will further slow corporate issuance.
Intermediate credit offers attractive risk/return potential
Intermediate credit is increasingly seducing sponsors for a whole host of reasons from economic, plan design issues and derivative-based solutions.
As discount rates for pensions rose significantly during first half of 2022, roughly 165–175 basis points, durations declined 13–14% based on the FTSE Pension Liability Index. The FTSE Pension Liability Index duration, at 21 at the beginning of the year, is now just over 18 years as of June 30. Over the same time frame, the FTSE “Short” Plan Index duration declined below 12 years, from more than 13 years.
Furthermore, cash balance plans, theoretically with zero duration, are emerging as a greater portion of liability in pension plans. This has been laid bare by annuitizations of retirees (referred to as retiree lift-outs) that are sweeping the pension landscape. This is because the commonly used 30-year Treasury rate, which serves as the basis for the annual interest credit to cash-balance accounts, is a negative offset to a plan’s overall duration and thereby further accelerates the decrease in a plan’s duration.
The flattening yield curve has made the financials of investing in the intermediate portion of the curve more compelling, as it offers similar levels of yield with less risk than long corporates (Fig. 8). Investors may also consider high-quality private placements—set firmly in the habitat of intermediate duration—which has historically provided a consistently higher yield than the intermediate corporate index. Given the flat yield curve, private credit may provide a comparable yield to long corporates with less volatility, along with other potential benefits such as reduced issuer concentration.
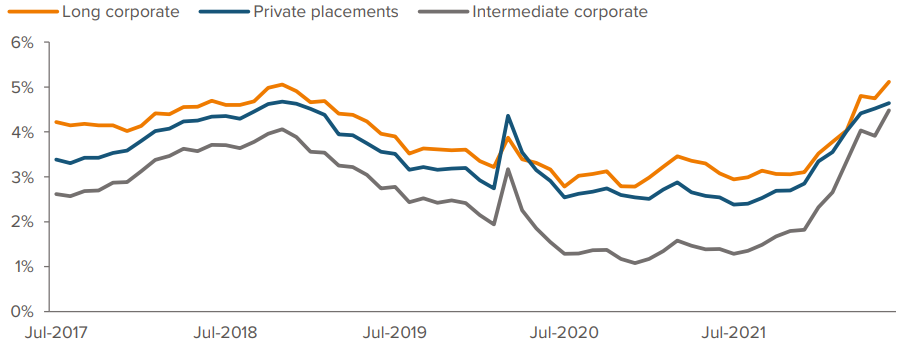
As of 06/30/22. Source: Voya Investment Management, Bloomberg. Data: Bloomberg U.S. Long Corporate Index; Bloomberg U.S. Intermediate Corporate Index; private placements yield based on the current investments held by Voya’s General Accounts, which we believe best represents the investment strategy. Indexes do not reflect fees, brokerage commissions, taxes or other expenses of investing, and investors cannot directly invest in an index. Past performance is no guarantee of future results.
However, sponsors should mind the credit spread of the long corporate, which may garner better excess returns in a spread tightening environment (Fig. 9). Lastly, sponsors need to evaluate their participant plan profile and duration targets when weighing allocations to intermediate and long corporate. The yield that could be achieved with intermediate is seductive and would need to be paired with overlays to sustain interest rate hedging across the curve.
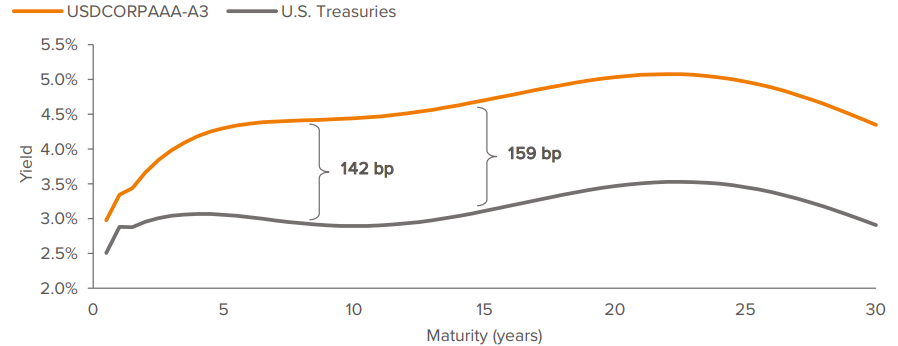
As of 06/30/22. Source: Bloomberg, Voya Investment Management. ICE BofA A–AAA Corporate Index, U.S. Treasury Index. Past performance is no guarantee of future results.
There is also a potentially major supply/demand undercurrent at play. Through the first half of 2022, supply was down 14% from the same prior-year period, as issuers have paused during the ongoing market volatility (Fig. 10). Compared with 2020, this represents half a trillion less in expected issuance. Yet with rates on the rise, plan sponsors have increased demand for long-duration bonds driven by their shift to fixed income assets to hedge the interest-rate and spread risk exposures of their liabilities. This growing supply/ demand imbalance may tighten spreads and prompt plan sponsors to expand their investable universe.
All of the above factors, alone or in combination, have prompted some sponsors to explore and adopt intermediate credit as they broaden their fixed income allocation.
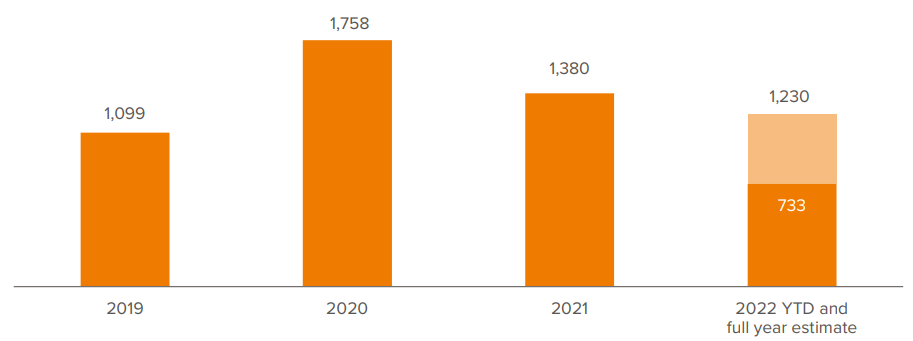
As of 06/30/22. Source: JPMorgan.
Expanding the investable universe to achieve objectives
The theme of de-risking in the first half of 2022 was matched with an intense focus on diversification. As rotation into fixed income continues, other asset classes are rapidly coming to the fore, and for good reason. There is much more to LDI than long government/credit and long corporate bonds. An emerging playbook of various combinations has proven successful. Such assets may include investment grade private placements, commercial mortgage loans and agency collateralized mortgage obligations, as well as other securitized credit instruments.
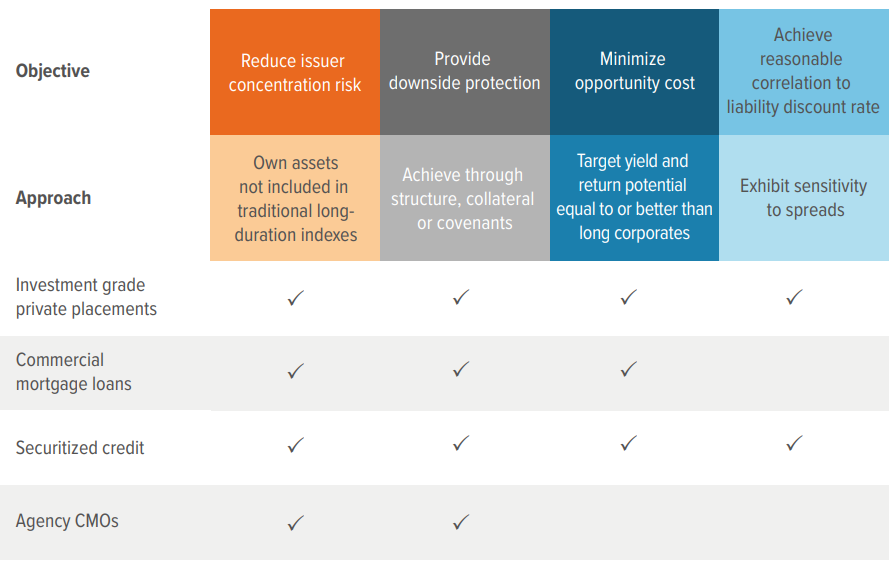
Our analysis has shown that diversifying assets, used in combination, have the potential to reduce tracking error to traditional benchmarks (or to the liability itself) better than traditional long-duration products. For example, pension plans with more mature hedging portfolios might consider a complementary solution in the intermediate space, as illustrated in Figure 11, which shows a blend of public and private investment grade credit with a modest allocation to CMLs. Compared to the Bloomberg U.S. Intermediate Corporate 2% Issuer Constrained Index, the outperformance of a custom LDI multi-sector solution during extreme volatility highlights unique potential benefits.
As of June 30, 2022, the portfolio outperformed the benchmark on a month, quarter and year-to-date basis, highlighting the efficacy of a multi-sector LDI strategy during a notable period of volatility. Over the past five years, the portfolio had a higher Sharpe ratio than that of the benchmark.
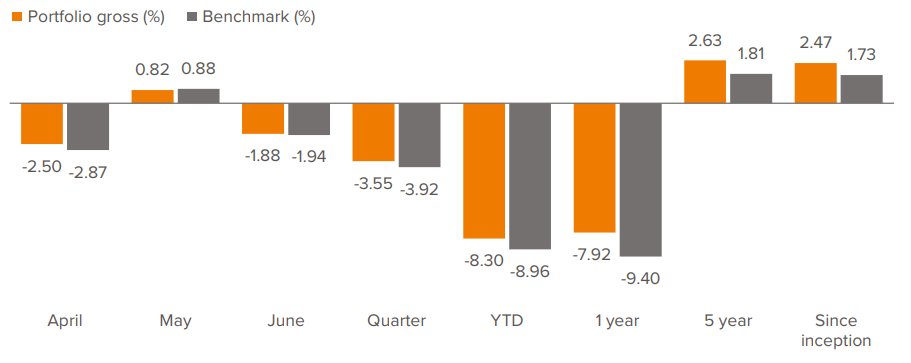

As of 06/30/22. Source: Bloomberg, Voya Investment Management. (1) Snapshot of portfolio allocation as of 6/30/22. Allocation has historically varied over time. Past performance is no guarantee of future results.
Taking care when considering annuitizations
With the improvement in funded status, annuitizations have come front and center for many sponsors. Although a certain feeling of FOMO may be taking hold, it may not be the most prudent solution for every sponsor. Nevertheless, sponsors are transferring their liabilities at a record pace. In 2021, markets experienced the biggest year of buyout sales since 2012 (Fig. 12). (A $33.8 billion print in pension risk transfer is shy of the watershed moment of 2012, when $34.6 billion was transferred by GM and Verizon alone.) In 2022, buyouts in the first quarter were greater than in the same quarter of the prior year. But the big news in the second quarter (too soon for data published by LIMRA) was the Lockheed Martin $4.3 billion annuitization in June, a sequel to the nearly $5 billion annuitization they did in 2021.

As of 03/31/22. Source: Group Annuity Risk Transfer Survey, LIMRA Secure Retirement Institute.
Whether an annuitization is right for one plan versus another depends on many factors. A particular company may find it beneficial to use low-balance annuitizations to reduce growing fixed-rate premiums (indexed to inflation) or to shrink the footprint of the pension plan relative to the overall enterprise.
However, these transactions remove the easiest liabilities to invest against and hedge, and they increase the share of liabilities in the residual plan, which are much more difficult to manage. Annuitization requires significant commitment of resources from multiple divisions, including HR, finance and the C-suite. And it may trigger settlement accounting.
Don’t forget that the care and maintenance necessary for the residual plan begins before the transaction is complete and entails ALMs, fixed income refurbishment and interest-rate hedge ratio management. Unless a full termination/annuitization is under consideration, sponsors should carefully consider the merits of a lift-out, with broad discussion involving all stakeholders and advisors.
Summary
- With funded ratios remaining high in the face of heightened economic uncertainty, we believe the merits of de-risking have only grown stronger.
- A systematic program of allocating across fixed income assets can help mitigate economic risks, aid in plan design, and manage portfolio duration.
- Sponsors may consider broadening their investable universe to include intermediate corporates and a combination of LDI diversifiers, such as highquality private placements, CMLs and securitized credit.


