When a familiar growth metric for tech companies called the “Rule of 40” meets our enhanced value framework, the result sets a new bar for cracking the code on value tech.
Conventional thinking falls short
In the fast-paced tech sector, traditional value metrics often struggle to find attractive stocks. Three characteristics of tech companies stand out for their tendency to blur the lens of conventional value screens:
- Technology companies tend to invest heavily in intangible assets, such as research and development, software and intellectual property.
- Tech companies are more likely to reinvest profits into growth opportunities rather than distributing them as dividends, which makes dividend yield a less relevant metric.
- A tech company’s book value is often misleading, because the rapid pace of innovation can quickly render physical and technological assets obsolete.
As a result, value strategies tend to underweight the technology sector or, worse, rely on these traditional metrics and then stumble into the dreaded “value trap.” Is there a better way?
Reassessing value with excess capital yield
Our value strategy uses an investment framework that emphasizes a proprietary Voya measure called excess capital yield. (See methodology below1 ). We apply ECY to evaluate how effectively a company uses and deploys its “dry powder,” typically in the form of dividend growth, share repurchases, accretive M&A and organic investment.
We have found that this approach provides deeper insights into a company’s strategic financial health and its potential to sustain growth and generate returns. This makes it a more relevant and insightful tool for assessing true value in the fast-paced world of technology.
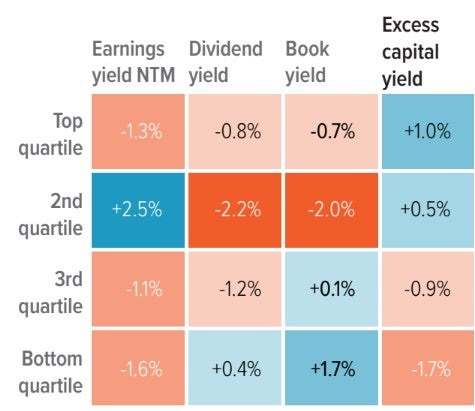
Historically, ECY has proven to be more effective than traditional value screens. Looking at the period January 2008 through December 2023, an analysis of the U.S. large cap software universe showed that stocks screened in the top quartile based on ECY generated higher excess returns, compared with stocks identified through book yield, dividend yield and earnings yield factors (Exhibit 1). Moreover, ECY’s quartile rankings offered successful indications of future returns, whereas other metrics were highly inconsistent, often ranking good stocks bad and bad stocks good.

For the period 01/01/08 to 12/31/24. Source: Voya IM, Russell, S&P, MSCI. Represents factor performance within the U.S. large cap software universe, comprising stocks in the GICS software and services industry group from the Russell 1000, S&P 500, S&P 400 and MSCI USA Large/Mid Cap indexes. The universe is partitioned into quartiles by each value metric, and performance is then calculated as the equal-weighted 12-month return. Past performance is not indicative of future results.
We’re off to a good start, but that’s not the end of the story. Our equity platform is designed with the goal of generating an information advantage supported by a culture we call “collaborative alpha.” Working with the fundamental analytics team, our software sector analyst found an even better way to assess value opportunities in the tech sector.
Collaborative alpha in action: The Rule of 40 enters the chat
The “Rule of 40” is a staple for growth-oriented investors in the tech space. The rule states that a company’s combined revenue growth and free cash flow margin should add up to at least 40%. The metric provides a quick litmus test of a company's operational efficiency, profitability and market competitiveness.
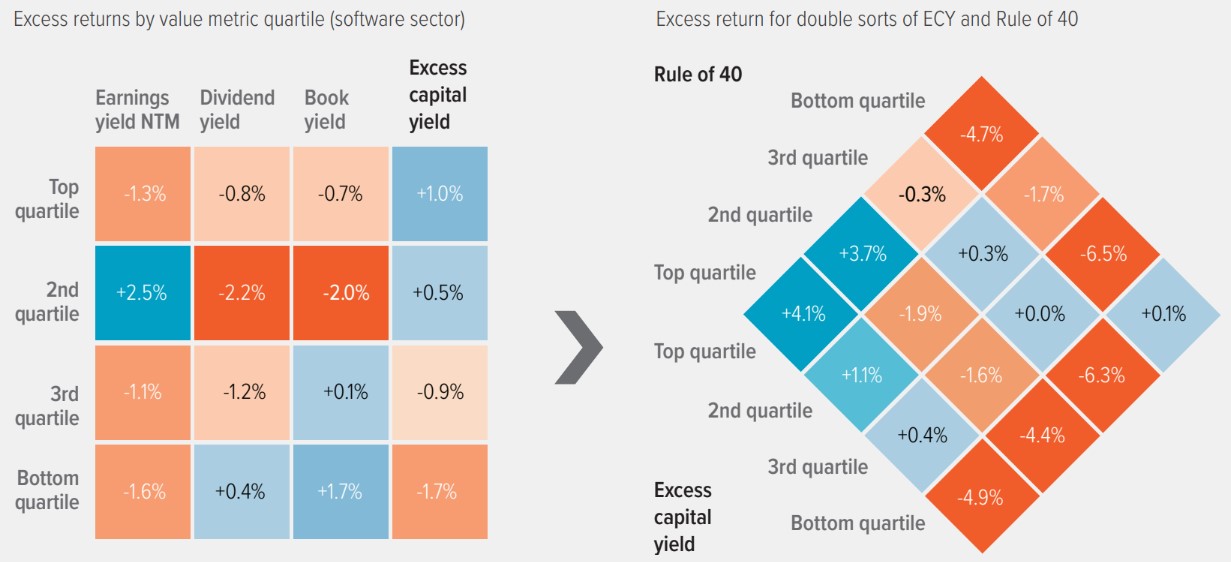
Looking at the same universe of software companies and time period used in Exhibit 1, stocks that screened well with both ECY and the Rule of 40 produced even higher excess returns than those screened with the ECY metric alone (Exhibit 2).
The combination of Voya’s ECY with the Rule of 40 provides a powerful lens to not only avoid the pitfalls of outdated value strategies but also uncover compelling investment opportunities that other value investors might overlook.
This combined framework is a prime example of Voya’s “collaborative alpha,” an organizational mindset that encourages the sharing of information across teams while preserving the unique strengths of each.
Exhibit 2. Combining ECY and Rule of 40 screens produced better results
For the period 01/01/08 to 12/31/24. Source: Voya IM, Russell, S&P, MSCI. For illustrative purposes. Represents factor performance within the U.S. large cap software universe, comprising stocks in the GICS software and services industry group from the Russell 1000, S&P 500, S&P 400 and MSCI USA Large/Mid Cap indexes. The universe is partitioned into quartiles on both Rule of 40 and excess capital yield metrics, and performance is then calculated for each quadrant as the equal-weighted 12-month return. Past performance is not indicative of future results. |
A note about risk The principal risks are generally those attributable to bond investing. All investments in bonds are subject to market risks as well as issuer, credit, prepayment, extension, and other risks. The value of an investment is not guaranteed and will fluctuate. Market risk is the risk that securities may decline in value due to factors affecting the securities markets or particular industries. Bonds have fixed principal and return if held to maturity but may fluctuate in the interim. Generally, when interest rates rise, bond prices fall. Bonds with longer maturities tend to be more sensitive to changes in interest rates. Issuer risk is the risk that the value of a security may decline for reasons specific to the issuer, such as changes in its financial condition. |


