Short-Duration High Income Bonds as a Defensive Building Block

Senior Vice President, Lead Portfolio Manager - Income & Growth

Key Takeaways
The investment case for US high yield is compelling —appealing total return potential supported by stable credit fundamentals.
Adding US high yield bonds to a core fixed income allocation has historically improved risk/reward profiles, but short-duration high yield in particular can help expand the efficient frontier.
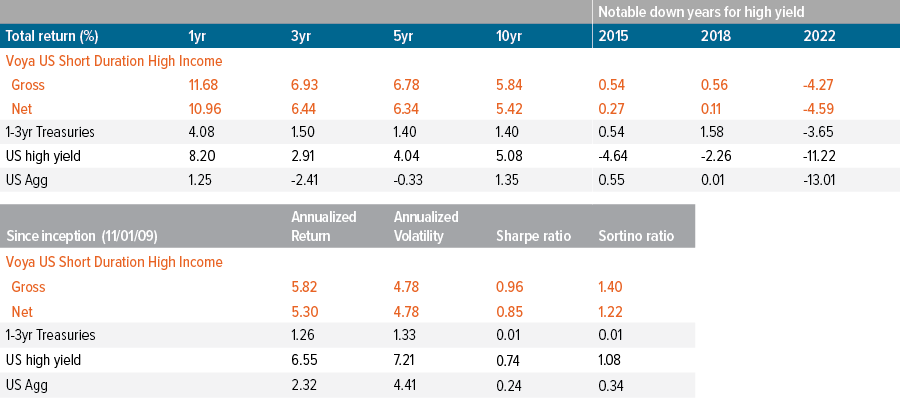
Voya’s Short Duration High Income Strategy has historically provided consistent income and strong risk-adjusted performance, outperformed core bonds with similar volatility, and delivered broad high yield bond market returns with less volatility.
Portfolio Manager Jim Dudnick discusses how, where and when to consider short-duration high yield bonds — and why the Voya Short Duration High Income Strategy is different.
Why is US high yield attractive today?¹
Looking at the broader US high yield market, we see multiple reasons why this is a compelling asset class. With yields over 7%, high yield offers the potential for equity-like returns but with less volatility. When we look at credit fundamentals, we also see strong support for the high yield market.
- Credit metric stability: Net leverage remains below the long-term average, and interest coverage is settling above the long-term average. The result is a high yield bond market that has a higher credit quality skew and is better positioned to weather an economic slowdown (should it occur).
- Muted default rate expectations: In addition to balance sheet health, near term refinancing obligations remain low, and management teams continue to exercise balance sheet discipline. Given these factors, the default rate for US high yield should stay below the historical average of 3-4%.
As of 12/31/24. Source: Voya Investment Management, FactSet, ICE Data Services. Past performance is not indicative of future results. See index associations and additional disclosures at the end of this document. Investors cannot invest directly in an index.
Why invest in the short end of the high yield market?
We see three primary benefits to investing in the front end of this asset class:
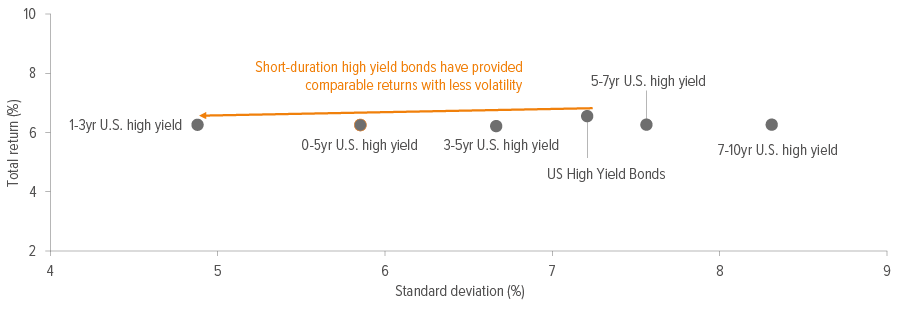
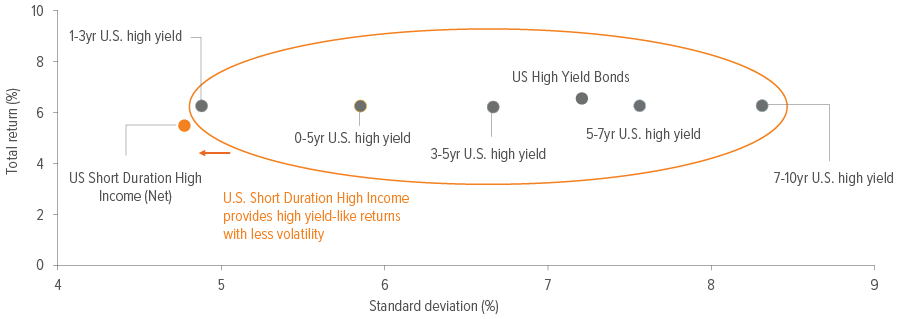
1. A better risk/return ratio. The front end of the US high yield market (as measured by the 1-3 Year US High Yield Index) has provided comparable returns to the broader US high yield market, but with significantly lower volatility (Exhibit 1).
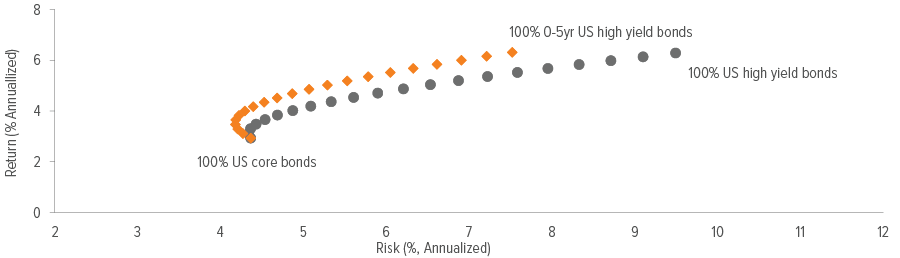
2. An expanded efficient frontier. Investors have long known that adding US high yield bonds to their core fixed income allocations can improve outcomes and expand the efficient frontier. But many investors don’t know that short-duration high yield has done a particularly good job of expanding the efficient frontier (Exhibit 2).
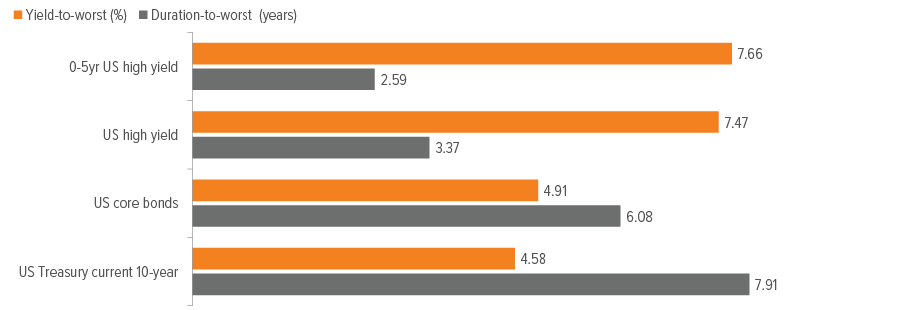
3. A compelling yield-to-duration tradeoff. Record-high new issuance and refinancing activity in 2020 and 2021 pushed coupons and interest expense down and maturities out, creating an even more compelling yield-to-duration trade-off at the short end of the US high yield market (Exhibit 3).
As of 12/31/24. Source: Voya Investment Management, FactSet, ICE Data Services. Past performance is not indicative of future results. See index associations and additional disclosures at the end of this document. Investors cannot invest directly in an index.
As of 12/31/24. Source: Voya Investment Management, FactSet, ICE Data Services. Past performance is not indicative of future results. See index associations and additional disclosures at the end of this document. Investors cannot invest directly in an index.
How has the Voya Short Duration High Income Strategy performed over time?
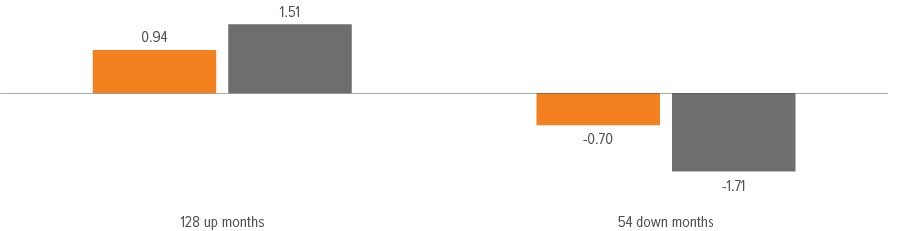
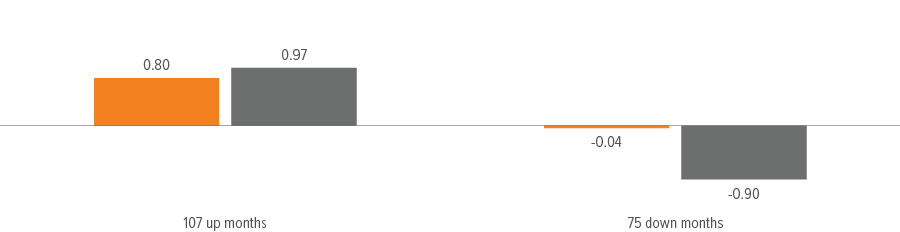
A key aspect of Voya Short Duration High Income’s history is its asymmetrical return profile. It has provided attractive upside with lower risk than the broader high yield market—including less price volatility, less drawdown and lower interest rate risk. Exhibits 4 and 5 highlight the Strategy’s upside and downside participation relative to the US high yield market, as well as its attractive overall risk-adjusted returns (driven largely by credit selection) compared with other fixed income segments.
As of 12/31/24. Source: Voya Investment Management, ICE Data Services. Past performance is not indicative of future results. The Composite represents the investment results of a group of fully discretionary portfolios managed according to the Strategy. Market participation is based on the average of monthly returns in up and down markets as determined by the respective index. Composite market participation is supplemental information to the US Short Duration High Income GIPS compliant composite presentation at the end of this document. See index associations and additional disclosures at the end of this document. Investors cannot invest directly in an index.
As of 12/31/24. Source: Voya Investment Management, Morningstar Direct. Past performance is not indicative of future results. The Composite represents the investment results of a group of fully discretionary portfolios managed according to the Strategy. Composite market participation is supplemental information to the US Short Duration High Income GIPS-compliant composite presentation at the end of this document. See index associations and additional disclosures at the end of this document. Investors cannot invest directly in an index.
Where does Voya Short Duration High Income fit into investor portfolios?
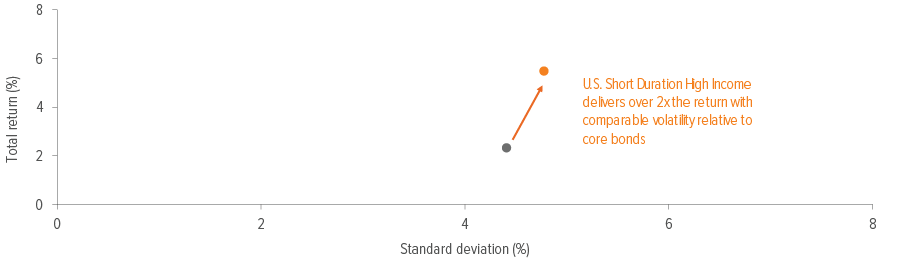
The Strategy has historically provided consistent income and strong risk-adjusted performance compared with fixed income, outperformed core bonds with similar volatility (Exhibit 6), and delivered broad high yield bond market returns with less volatility (Exhibit 7).
As a result, one way to use Voya Short Duration High Income is to complement an allocation to full-market high yield. The Strategy has a lower beta to the high yield market, potentially enhancing portfolio diversification by offering a narrower range of annual returns, and providing an asymmetric return profile.
Voya Short Duration High Income can also be a good complement to a core fixed income allocation (Exhibit 8). The Strategy’s low correlation to core bonds helps diminish the magnitude of negative performance outcomes and reduces overall volatility—all while enhancing returns and improving positioning with a higher yield and a lower duration.
As of 12/31/24. Source: Voya Investment Management, FactSet, ICE Data Services, Morningstar. Past performance is not indicative of future results. Composite market participation is supplemental information to the US Short Duration High Income GIPS-compliant composite presentation at the end of this document. See index associations and additional disclosures at the end of this document. Investors cannot invest directly in an index.
As of 12/31/24. Source: Voya Investment Management, FactSet, ICE Data Services, Morningstar. Past performance is not indicative of future results. Composite market participation is supplemental information to the US Short Duration High Income GIPS-compliant composite presentation at the end of this document. See index associations and additional disclosures at the end of this document. Investors cannot invest directly in an index.
As of 12/31/24. Source: Voya Investment Management, ICE Data Services. Past performance is not indicative of future results. The Composite represents the investment results of a group of fully discretionary portfolios managed according to the Strategy. Market participation is based on the average of monthly returns in up and down markets as determined by the respective index. Composite market participation is supplemental information to the US Short Duration High Income GIPS-compliant composite presentation at the end of this document. See index associations and additional disclosures at the end of this document.
How did the Strategy perform in 2022?
Despite market volatility, the Strategy performed well as higher interest rates pressured fixed income. High yield corporates and core bonds returned -11.2% and -13.0%, respectively, in 2022.1 By contrast, the Voya Short Duration High Income Composite declined just -4.6% (net).2 Our focus on shorter-duration issues and industries with positive business trends, along with a bias towards quality companies prioritizing the repayment of debt, helped cushion downside volatility.
Voya US Short Duration High Income
Objective: Capital preservation, consistent income and liquidity
Average duration: 1.5–2.0 years
Weighted average life: 3.25–3.75 years
Typical portfolio: Invests in bonds with less than five years to maturity; avoids the added cost and complexity of derivatives, leverage, hedging and foreign currencies, and can invest up to 20% in bank loans.
Philosophy: Active management focused on in-depth industry assessment, thorough fundamental analysis and rigorous credit research can uncover compelling investment opportunities and minimize portfolio volatility, producing superior risk-adjusted performance.
Proven investment process: The bottom-up investment process combines comprehensive industry assessments with a detailed fundamental review of the company and thorough credit research. We conduct our own independent research and analysis, which allows the strategy to focus on minimizing the three main risks of fixed income investing—interest rate risk, credit risk and liquidity risk—to produce compelling risk-adjusted investment opportunities.
Compelling performance track record: The US Short Duration High Income Strategy has outperformed core bonds with similar levels of volatility, delivered broad high yield market returns with less volatility, and consistently provided strong risk-adjusted performance.
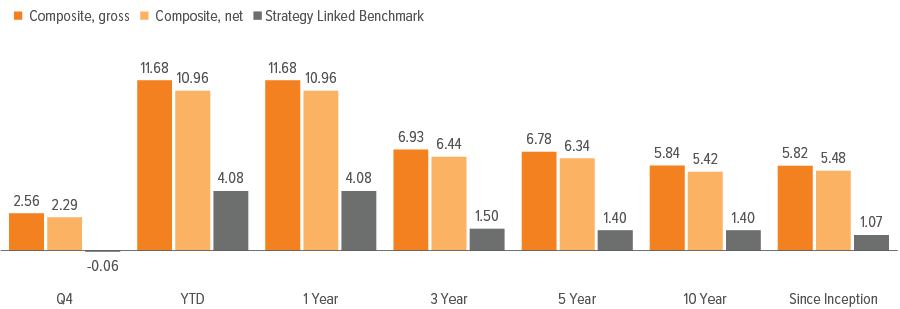
As of 12/31/24. Voya Investment Management claims compliance with the Global Investment Performance Standards (GIPS®). GIPS® is a registered trademark of CFA Institute. CFA Institute does not endorse or promote this organization, nor does it warrant the accuracy or quality of the content contained herein. Past performance does not guarantee future results. Performance numbers for time periods greater than one year are annualized. The Composite represents the investment results of a group of fully discretionary portfolios managed according to the strategy. Returns include the reinvestment of income. Gross-of-fees returns are presented before management and custodial fees but after all trading expenses. Net-of-fees returns are calculated by deducting a hypothetical management fee from the gross return on a monthly basis and geometrically linking the results to produce returns shown. The hypothetical management fee is equal to or greater than the asset-weighted average of each accounts’ fee schedule in the composite. The model fee used will result in a net return that is equal to or lower than a net return using actual fees. For a description of advisory fees, please see Form ADV, Part II. Gross returns should be used as Supplemental Information only
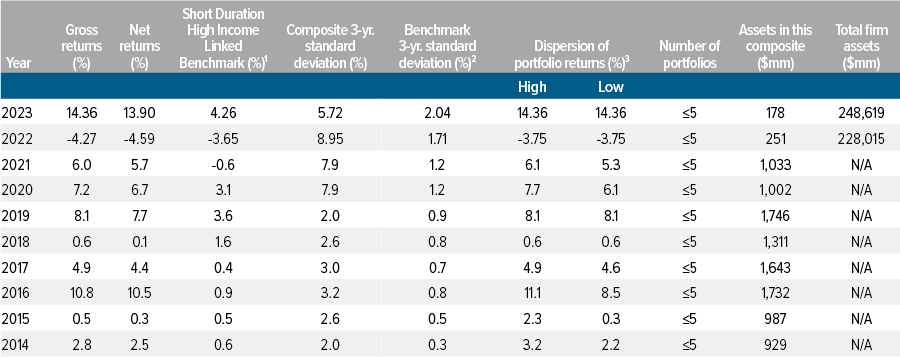
1 The Barclays 9-12 Treasury Index returns through December 31, 2013 and the ICE BOA 1-3 Year US Treasury Index from January 1, 2014 forward, which do not reflect the deduction of investment fees, have been provided for comparison purposes and have not been examined by independent accountants.
2 “Composite 3-Yr St Dev” and “Benchmark 3-Yr St Dev” are rolling 3-year standard deviation calculations, which measure the variability of the gross-of-fee monthly performance returns for the composite and benchmark index return over the preceding 36-month period on an annualized basis. If the composite has not been in existence for at least
3 years as of a particular year-end then “N/A” will be displayed. 3 “Dispersion of Portfolio Returns” presented for each annual period is based on gross-of-fees returns and is equal to the highest and lowest annual return among the portfolios that are included in the composite for the full year. If there is not at least 1 account that was in the composite for the entire year, then “N/A” will be displayed