
Mohamed Basma, CFA
Managing Director, Head of Leveraged Credit
Weekly Notables
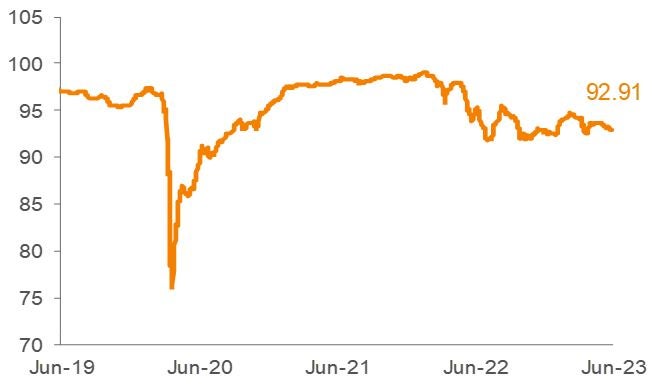
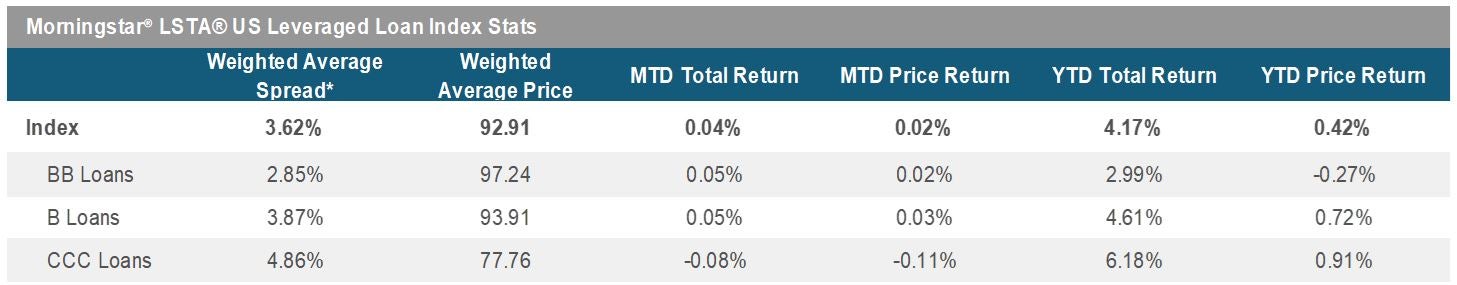
The US loan market closed out May on a weak note. The Morningstar® LSTA® US Leveraged Loan Index (Index) returned 0.14% for the seven-day period ended June 1. The average Index bid price declined by 2bp, finishing out the period at 92.91.
On the new issuance side, a handful of new deals were arranged this week. Looking at the forward calendar, net of the anticipated $4.6 billion of repayments not associated with the forward pipeline, the amount of repayments now outstrip net new supply by about $126 million, versus $2 billion in the prior weekly estimate.
The secondary loan market performance softened during the week. In terms of rating cohorts, Double-B, Single-B and CCC loans posted returns of 0.18%, 0.14% and 0.06%, respectively.
CLO issuance moved higher compared to last week, as managers issued seven new vehicles, bringing the YTD level to $50.11 billion. On the other hand, outflows in retail loan funds moderated, as investors withdrew $628 million from funds during the week (Morningstar Direct).
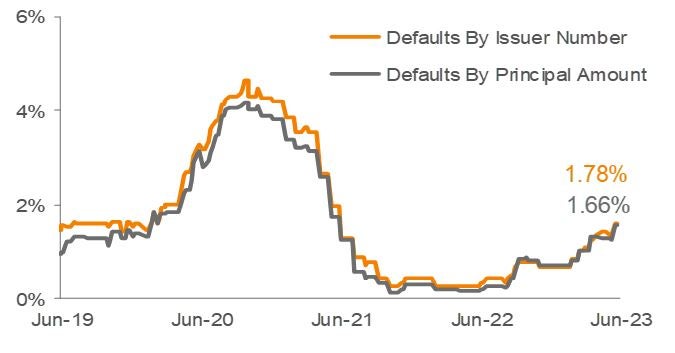
There were three defaults (Diebold Nixdorf, GenesisCare and Lucky Bucks) in the Index this week, as the trailing 12-month default rate by principal amount moved up to 1.66% (from 1.58% in May).
Source: Pitchbook Data, Inc./LCD, Morningstar ® LSTA ® Leveraged Loan Index. Additional footnotes and disclosures on back page. Past performance is no guarantee of future results. Investors cannot invest directly in the Index. *The Index’s average nominal spread calculation includes the benefit of base rate floors (where applicable).
Monthly Recap: May 2023
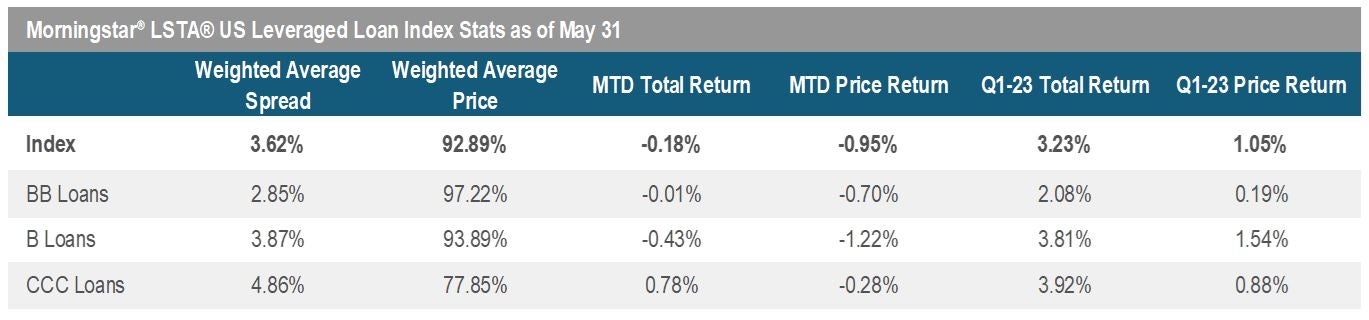
Performance in the US loan market was marked by declines in loan prices as the Index returned -0.18% in May following last month’s positive gains. The average Index bid price drifted lower by 78bp, closing out the month at 92.89. However, on a YTD basis, loans returned 4.12%. Loans continued to outperform other asset classes this month, as treasuries, investment grade and high yield bonds posted negative returns of -1.46% (S&P 10-year Treasury Index), -1.46% (Morningstar US Corporate Bond Index) and -0.93% (Morningstar US High-Yield Bond TR USD), respectively.
From a credit ratings perspective, CCC loans led all categories at 0.78%, while BBs and Bs were in the red at –0.01% and –0.43%, respectively. On YTD basis, lower-rated credits performed better than higher-rated credits. For context, CCCs and Bs were in the lead with returns of 6.27% and 4.56%, respectively, while BBs returned 2.94%.
In the primary market, new issuance remained subdued, as total issuance was just $12 billion, bringing YTD volume to $87.1 billion. Volume continued to be driven by refinancings, while M&A and LBO activity remained low. The size of the loan market, as represented by total Index outstandings, declined by $5.37 billion to $1.39 trillion in May.
Turning to investor demand, the CLO market was active compared to April, as managers priced $10.6 billion across 25 new vehicles in May. However, total volume declined 15% year over year, at $50.5 billion versus $58.5 billion for the comparable period in 2022. On the other hand, loan retail funds extended the latest streak of outflows to 13 months, as $3.9 billion exited the market during the month. Outflows currently stand at $17.5 billion YTD, versus an inflow of $20.3 billion for the comparable period last year (Morningstar Direct).
There were three defaults (Envision Healthcare, Venator Materials Corp and Monitronics International Inc) in the Index in May, as the trailing 12-month default rate by principal amount moved higher to 1.58% (from 1.31% in April).
Source: Pitchbook Data, Inc./LCD, Morningstar ® LSTA ® Leveraged Loan Index. Additional footnotes and disclosures on back page. Past performance is no guarantee of future results. Investors cannot invest directly in the Index. *The Index’s average nominal spread calculation includes the benefit of base rate floors (where applicable).