The following are historical insights based on market conditions at a point in time. Any forward-looking statements contained herein are based on information at the time. Current views, performance and portfolio information may differ materially from those expressed or implied in such statements. Voya IM makes no representation that past publications will be updated.
Creditor sentiment has shifted in the upstream energy sector between optimism and pessimism. We retrace boom-and-bust periods over the past decade and chronicle improvements in the credit quality of North American energy companies following the pandemic.
Letter from the energy and infrastructure team
Dear Investor,
It is our pleasure to announce the inaugural edition of Energy & Infrastructure Quarterly, a newsletter from Voya Investment Management’s private credit group covering topics germane to energy and infrastructure investment. Going forward, Voya PCIG’s energy and infrastructure team will provide investors with a quarterly newsletter outlining recent transaction flow and a deep dive into a special topic. The special topic is intended to provide investors with additional insights beyond those typically provided in Voya PCIG’s investment memoranda. We hope that you find the insights prescient and enjoy reading the newsletter as much as we enjoyed creating it. As always, we are happy to answer any questions that you may have.
Sincerely,
The Voya PCIG energy and infrastructure team
Recent infrastructure transactions
Since April, Voya PCIG has invested $292.5 million into four infrastructure transactions. The below table provides an overview of Voya PCIG’s recent investments.
In addition to these investments, Voya PCIG reviewed an additional seven investments but declined to participate due to price, structure, business risk, or a confluence of the three. One notable transaction that Voya PCIG declined to participate in was a crude oil pipeline stretching from the Permian and Eagle Ford basins to demand centers in Corpus Christi and Houston. Voya declined to participate due to the pipeline’s recontracting and refinancing risks, which in Voya’s opinion were not appropriately addressed by the price or structure.
Pendulum of Perception
In this quarter’s special topic, Pendulum of Perception, we will explore how creditor sentiment has shifted in the upstream energy sector between optimism and pessimism. We will retrace the boom-and-bust periods of the North American upstream energy sector over the past decade and chronicle improvements in the credit quality of North American energy companies following the Covid-19 pandemic. We will also explore investment opportunities in upstream energy for private investors, driven by a dearth of bank capital, tighter ESG restrictions, and improved upstream credit profiles.
Pendulum of Perception will be the first edition in a series exploring the broader energy complex. Given that upstream energy serves as the genesis for the conventional energy value chain, we believe that a grounding in the recent history of the upstream energy sector is an ideal starting point in our journey through the energy ecosystem.
Unleashing American energy
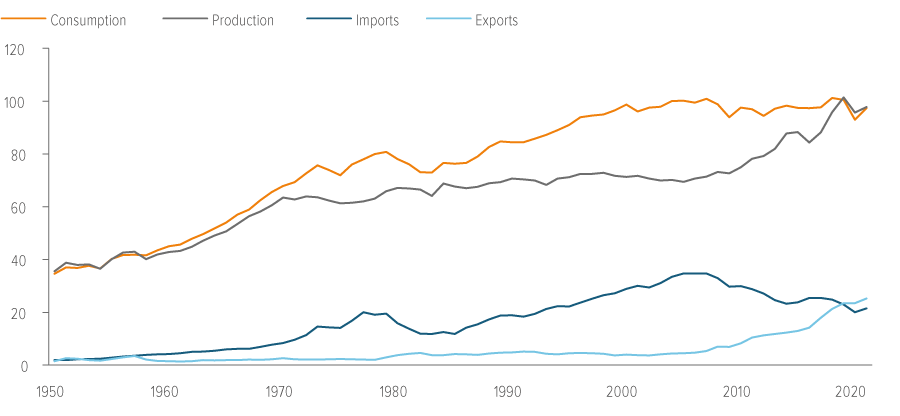
Prior to 2019, the United States was a net energy importer, relying on foreign countries to meet domestic energy needs, a trend that had persisted since 1952. U.S. energy imports peaked in 2005, when the U.S. imported ~30% of the energy it consumed. Since 2005, energy imports have waned, culminating in the U.S. becoming a net exporter of energy in 2019 (Exhibit 1). The United States’ shift from net importer to net exporter was driven by the adoption of enhanced recovery techniques, namely hydraulic fracturing and directional drilling.
Source: Energy Information Administration.
Enhanced recovery techniques have been used to develop over 1.7 million wells in the U.S.
The theory behind hydraulic fracturing, or “fracking,” came shortly after Edwin Drake’s discovery of oil in Titusville, Pennsylvania, in 1859. The first attempt at fracturing hard rock surrounding oil reservoirs can be traced to 1865, when Edward Roberts filed a patent for an “oil well torpedo.” Roberts’ torpedo was designed to enhance oil well productivity by fracturing subterranean rock formations, releasing oil trapped within them. Over the next 140 years, while oil giants such as Halliburton filed additional patents for enhanced oil recovery techniques, the process remained largely unused.
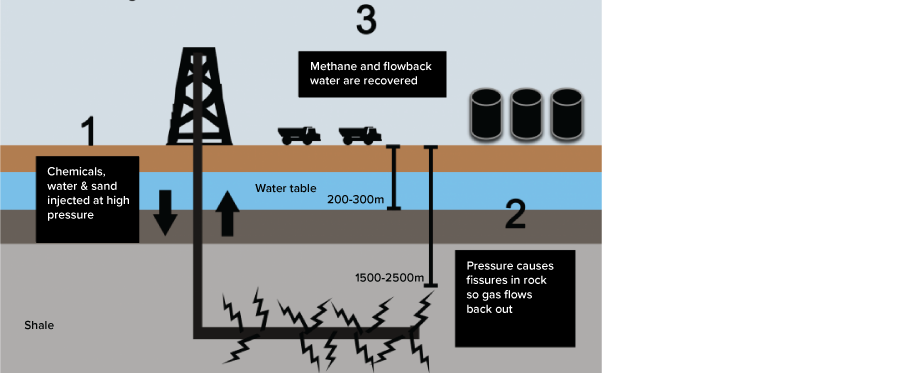
The industry changed when George Mitchell combined hydraulic fracturing with another energy innovation, horizontal drilling. Mitchell’s initial success involved the drilling of horizontal wells in the Barnett Shale outside of Fort Worth, Texas. Mitchell’s teams would drill horizontal wells which they would then “frack” by shooting a mixture of water, chemicals and sand down the wellbore at high pressure. The fracking process would cause targeted shale rock formations to fracture and release “tight” oil and gas trapped in smaller pockets within the shale rock that would have been uneconomic to lift using conventional drilling techniques. The long “laterals” resulting from the horizontal drilling process allowed Mitchell’s teams to enhance the amount of oil and gas recoverable, as they were able to tap into a longer range of reservoirs than could be accessed by vertical drilling (Exhibit 2).
Prior to Mitchell’s discovery, there was widespread concern that the U.S. would deplete its energy endowment. By changing drilling methods, a broader array of formerly uneconomic reserves became highly economic. According to the Independent Petroleum Association of America, enhanced recovery techniques have been used to develop over 1.7 million wells in the U.S., which have produced over 7 billion barrels of oil and over 600 trillion cubic feet of natural gas. In 2022, hydraulic fracturing accounted for ~66% of U.S. crude oil production and ~80% of U.S. dry natural gas production, according to the Energy Information Administration.
Source: Energy and Climate Intelligence Unit.
Growth at an (un)reasonable price
Much like the California gold rush in the 1800s or Silicon Valley in the 1990s, new entrants rushed in. Mitchell’s process was quickly adopted by upstart independent exploration and production (E&P) companies backed by private equity capital. The independent E&Ps further augmented Mitchell’s techniques, combining them with directional drilling, artificial lift and other technological innovations to further enhance hydrocarbon recoveries from individual wells. If Mitchell’s process was the match, then directional drilling and other advances were the gasoline that acted as an accelerant for the shale boom. The confluence of these technologies allowed upstream companies to target new formations at a much lower cost, changing the energy landscape forever.
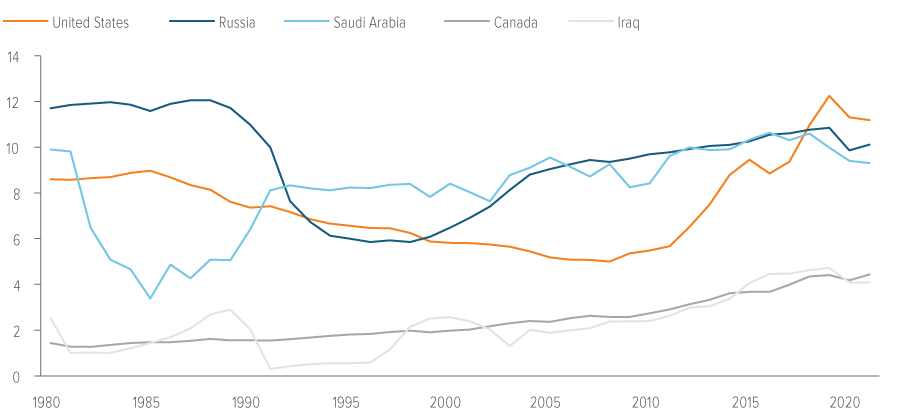
Overnight, it seemed as if the industry shifted from a stable manufacturing business where improvements were linear to a disruptive technology business where improvements were exponential. The independents used their technology, equity capital and large amounts of debt to aggressively acquire drilling acreage in newly economic formations across the U.S., leading to unprecedented growth in U.S. oil production (Exhibit 3).
Source: Energy Information Administration.
The independents’ ability to grow rapidly was driven by several factors, including:
- Accommodative debt markets
- Sustained high oil prices
- Shareholder and management ebullience
Accommodative debt markets: Following the great financial crisis in 2008 and 2009, the U.S. Federal Reserve embarked on a prolonged period of zero interest rate policy (ZIRP). ZIRP caused capital market participants, including many lenders, to step further out on the risk curve to earn higher rates of return. As investors eschewed safer assets in favor of riskier alternatives with higher projected yields, independent oil and gas companies were able to borrow increasingly larger amounts of debt at attractive rates to finance growth through the drill bit.
Sustained high oil prices: Senior secured reserve-based loans are a material part of an E&P’s capital structure, particularly for smaller E&Ps that lack broad capital market access. To determine the size of a reserve-based loan facility, lenders estimate the value of the discounted future cash flows of the company, considering projected commodity prices. Lenders then allow the company to borrow at an agreedupon advance rate, which serves as a proxy for general uncertainty. The output of this analysis results in a borrowing base on which the company may draw to finance operations. All else being equal, higher commodity prices result in a higher borrowing base (Exhibit 4). During the shale boom, banks employed aggressive assumptions in their borrowing bases. Banks’ willingness to employ aggressive assumptions was driven by recency bias from sustained high prices and additional fees earned by cross-selling other services to upstream borrowers, which effectively subsidized the incremental risk taken on reserve-based loans. In addition to the reserve-based loans, many upstream companies employed unsecured debt and junior debt to further finance acquisitions of acreage, both of which also derived their value from future reserve monetization.
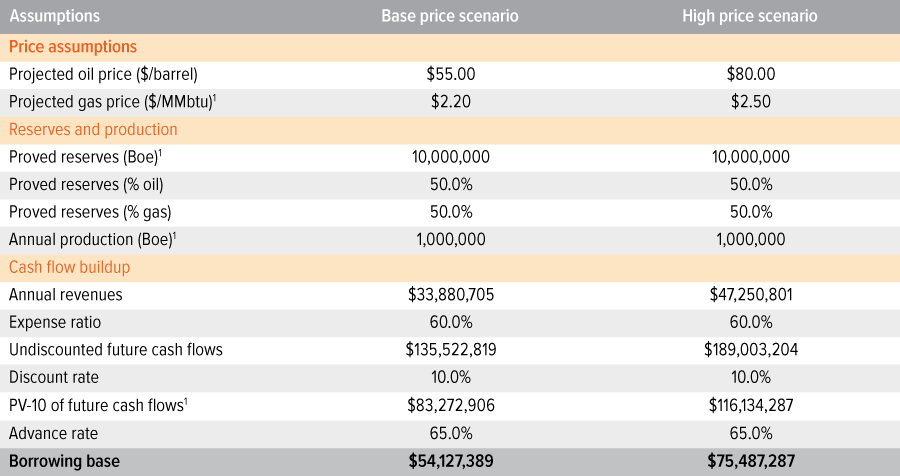
Source: Voya IM. 1 Millions of British thermal units, barrels of oil equivalent and present value at 10.0% discount rate.
Shareholder and management ebullience: Much like the fictional town of Lake Wobegon, where “all the women are strong, all the men are good-looking, and all the children are above average,” both shareholders and management exhibited overconfident behavior during the shale boom. Management teams were overly confident in their ability to extract hydrocarbons from their acreage, causing them to overestimate their proved reserves and make aggressive projections of cost efficiencies. Shareholders were overly optimistic that oil prices and values for upstream energy companies would continue to grow in the future as they had in the past, resulting in aggressive valuation multiples.
Much as the seeds of war are planted in times of peace, the seeds of bust are planted in times of boom. The seeds of accommodative debt markets, sustained high oil prices, and shareholder and management ebullience blossomed into a shale bust in 2015 and 2016 that repeated itself in 2020 following the Covid-19 pandemic.
Lenders and shareholders essentially priced debt and equity securities to perfection.
The tide goes out, twice
As Warren Buffet said, “It’s only when the tide goes out that you learn who’s been swimming naked.” In the case of the upstream energy sector, the tide went out twice over the past decade, once in the 2015-2016 shale bust and again following the Covid-19 pandemic.
Following the proliferation of Mitchell’s fracking process, and fueled by easy money and sustained high oil prices, upstream companies were able to amass large acreage positions. As E&Ps began to develop acreage, they were able to increase efficiency, driving down drilling and completion costs and increasing cash flow. Management then used this cash flow to purchase additional acreage and expand their platform. Lenders and shareholders were complicit, and they began to ascribe value to the anticipated cash flows of the platform, giving management credit for projected efficiencies and future acreage additions rather than the cash flows from existing acreage. The situation was exacerbated by sustained high oil prices, recency bias, and the large fees that banks were able to earn by providing additional services to growing upstream companies. Lenders and shareholders extrapolated current high prices into the future, which gave upstream companies greater access to capital markets and essentially priced debt and equity securities to “perfection.”
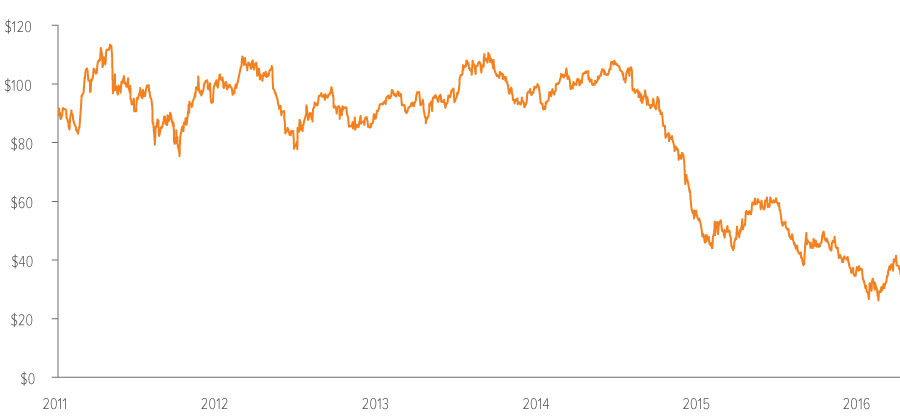
Cracks began to emerge in September 2014 (Exhibit 5). It became apparent that the growth rate in the upstream energy sector was incongruous with sustained high commodity prices. Despite this, upstream companies continued to produce hydrocarbons, as many of them had hedged future production or had production costs below the spot price of oil. Contemporaneously, members of OPEC saw the growth in U.S. domestic production as a threat and elected to maintain production levels in November of 2014 despite falling prices.
Source: Energy Information Administration
On the demand side, global storage capacity began to fill. Without ample storage capacity to absorb hydrocarbons sold forward, the derivatives markets began to re-price, resulting in forward prices below spot prices. The spot market responded in kind. At the same time, concerns about China’s ability to continue robust growth also began to emerge, further exacerbating downward pressures. The trend continued into 2015, and by February of 2016, the price of oil bottomed at $26.19 per barrel, representing ~24% of price levels seen 20 months prior. For companies that had “bet the farm” on continued high prices and aggressively issued debt, the tide had finally gone out. According to Haynes and Boone, an energy-focused law firm, there were over 135 bankruptcies amongst North American upstream energy companies, representing over $82 billion of claims between 2015 and 2017. While senior secured lenders extending reserve-based loans were largely made whole in bankruptcy, unsecured creditors, junior lenders, and equity holders faced significant losses as their underwriting theses failed to materialize.
As with most commodity markets, the best cure for low prices is low prices. Prompted by historically low prices, energy producers began to curtail production. Over-levered producers faced balance sheet restructurings following defaults. Slowly, prices and balance sheets began to recover. Shareholders and lenders began to place more onerous expectations on upstream energy companies to maintain capital discipline rather than solely targeting growth through the drill bit. E&Ps began to shift their operations away from exploration and towards production. Overall, the industry appeared to be getting its house in order as oil prices returned to levels around historical averages from 2017 to 2019, although some companies continued to operate at elevated leverage levels.
The market changed in March 2020, when Covid-19 was declared a global pandemic. Commerce, travel and life effectively ground to a halt as most societies locked down in an attempt to inhibit the spread of the pandemic. Demand for oil plummeted along with the lockdown, causing front-month WTI futures to trade at negative prices in April 2020 for the first, and only, time in history. As in the period following the shale bust, upstream energy companies curtailed production and drilling activities. Adroit management teams, scarred from the last downturn, began to sell off noncore assets to generate liquidity and used the proceeds to repay outstanding debt. Companies with weak balance sheets also sought peers with stronger balance sheets to either be acquired by or merge with. Overall, the impacts of the Covid-19 crisis were more moderated than the 2015–2017 period. In total, 66 companies declared bankruptcy in 2020 and 2021, which reflected $55.2 billion of total claims. While both figures reflect an industry in crisis, it was a far cry from the destruction left in the wake of the shale bust.
Cash flow makes a comeback
As the world emerged from the pandemic, E&Ps faced a vastly different financing market. Lackluster recent performance by upstream energy and increased focus on environmental, social and governance (ESG) factors caused many banks and investors to put E&Ps in the “too hard” category. Energy fell as a percentage of the S&P 500 to 2.3% in 2021 from 12.3% a decade prior. Lenders and investors who remained willing and able to invest in upstream energy demanded that operators focus on capital discipline rather than production growth. Many upstream companies found their typical financing routes were closed. As a result, they had to seek alternative sources of capital including reserve securitizations and direct lending funds, the former of which has grown to over $7 billion of issuance over the past few years.
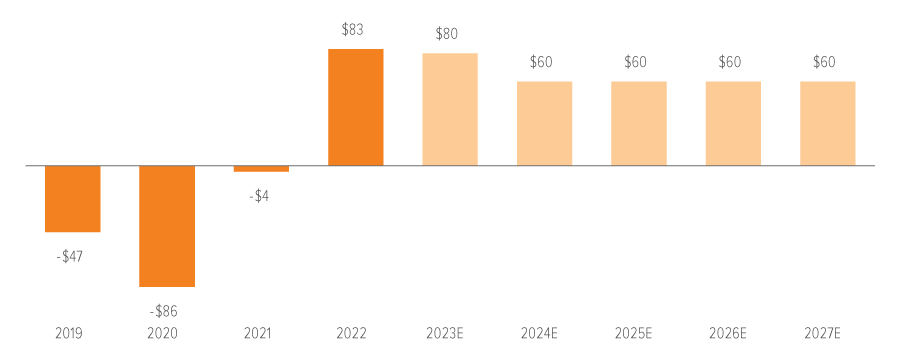
Management teams acquiesced to the changing sentiment and shifted their operations to focus on cash flow generation and financial resilience. While production grew from 2020 lows as the world emerged from the pandemic, it did so at a more moderated pace. McKinsey & Company conducted a study of the largest 25 independent upstream energy companies in North America to assess their response to investor cries for greater financial stability. The companies generated $83 billion of operating free cash flow in 2022, driven by higher oil prices and greater cost discipline, a far cry from prior years (Exhibit 6).
Source: McKinsey & Company.
Management teams reduced cumulative debt balances by $25 billion from 2021 to 2022.
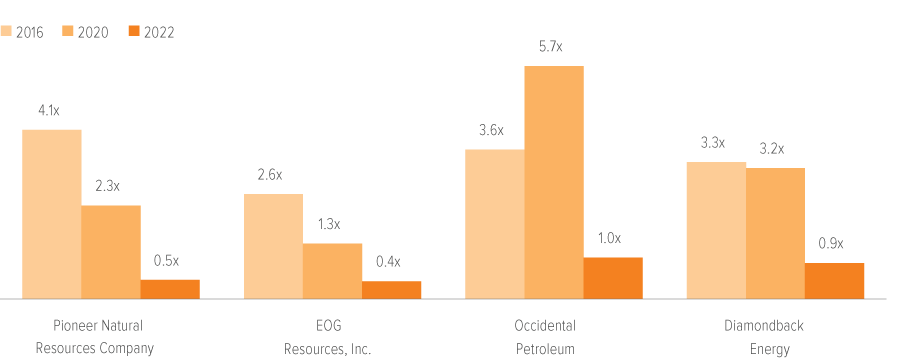
Despite oil prices being above $80 per barrel in 2022, management teams at the 25 largest E&Ps in North America maintained their no-to-low growth strategy, reducing cumulative debt balances by $25 billion from 2021 to 2022. As Russia invaded Ukraine and the world’s energy supply chains restructured in response, E&Ps remained disciplined, forgoing an opportunity to lever up to take advantage of high commodity prices. The result is an industry with a much stronger collective balance sheet than in the years of the shale boom and bust, with many upstream energy companies operating at below 1.0x debt/EBITDA (Exhibit 7).
Source: Capital IQ.
While the credit profiles of many upstream companies have markedly improved, lenders and investors have been reticent to re-enter the upstream energy sector. Despite much-improved balance sheets, higher commodity prices, and a global focus on energy security, the upstream energy industry is facing difficulty securing debt and equity capital. Many management teams view operating cash flow as one of their only reliable sources of funding.
The rumors of my death are greatly exaggerated
As Mark Twain quipped regarding rumors of his own death, speculations about the demise of upstream energy have been greatly embellished. Following the shale bust and Covid-19 pandemic, management teams have focused on delivering and returning capital to shareholders rather than growing through the drill bit. Improved E&P balance sheets, a renewed focus on energy security following Russia’s invasion of Ukraine, and a focus on grid resilience following extreme weather events have served to de-risk upstream energy investments.
The improvement in credit quality has coincided with two other factors that create a compelling investment opportunity for institutions willing and able to invest in upstream energy. First, commercial banks are retrenching from reserve based lending, long the lifeblood of smaller upstream energy companies. The banks’ retrenchment is driven by their experience in the shale bust, fewer opportunities to earn ancillary fees by banking upstream clients, higher capital reserve requirements, and concerns about ESG. Second, many institutional investors are eschewing investment in both greenfield and brownfield hydrocarbon exploration and production due to pressures from stakeholders over ESG risks. The confluence of these events has increased the cost of capital to upstream energy companies despite step-change improvements in their credit metrics and a renewed focus on supply security.
Private investors willing to step into the breach can expect to be rewarded for doing so.
Private investors willing to step into the breach and finance upstream energy companies can expect to be rewarded for doing so. Investors benefit from issuers with much-improved credit profiles, more attractive spreads relative to the underlying credit metrics, and an ability to drive more attractive terms given the dearth of capital in the sector.
Waiting on the perfect pitch
Following the shale bust and the Covid-19 pandemic, Voya maintained a posture of opportunism towards upstream energy. Much like a discerning batter at the plate, we have patiently waited on transactions that fall in our sweet spot, electing to swing only when we are able to invest in durable credits at attractive prices and on advantageous terms. When we have swung, we have led deals, driven pricing wider, and negotiated structural enhancements. As we continue to evaluate upstream investment opportunities, we invite you to step into the batters’ box with us and swing for the fences as the perfect pitch is thrown.
Historically, upstream issuance in the U.S. private placement market was limited to several Canadian issuers and a few smaller U.S. companies. Deal flow was consistent prior to the shale bust, but waned considerably as issuers’ credit metrics faced pressure. Recent deals have been structured differently than traditional corporate issuances, with many reflecting reserve-based securitizations that require a more specialized skillset to underwrite. We have evaluated a number of reserve-based securitizations and believe they represent a compelling opportunity for adroit investors to earn potentially attractive yields from portfolios with stable operating characteristics.
While the U.S. private placement market has not presented as many upstream opportunities of late, an understanding of the dynamics underpinning upstream energy is part and parcel of investing in the broader energy complex. Our knowledge of the upstream energy space has enabled us to better appreciate the nuanced economics supporting liquefied natural gas, midstream, and power assets. In subsequent editions of Energy & Infrastructure Quarterly, we will explore these asset types in greater detail given their importance to Voya PCIG’s portfolio. Our next special topic, Made in America, will include a deep dive into an industry made possible by the shale revolution: U.S. LNG exports.
We invite you to step into the batters’ box with us and swing for the fences as the perfect pitch is thrown.
