
Key Takeaways
With policy uncertainty near pandemic highs, stock market volatility has risen as investors react to every stutter step by the White House.
We believe high quality bonds are poised to benefit in this uncertain environment. Additionally, we think sectors backed by U.S. real estate and consumer credit, should fare better than corporate credit sectors that are more exposed to tariff-induced uncertainty.
We think stable value stocks—particularly inexpensive businesses with durable fundamentals—are well positioned to weather the volatility.
Fears of an economic downturn are heating up amid tariff threats, federal workforce cuts, a potential government shutdown, and declining consumer sentiment. How should investors navigate this rising uncertainty?
What’s driving volatility?
In early March, the Nasdaq entered correction territory for a short while (falling 10% from its previous high), the S&P 500 experienced seven consecutive days of 1% or more moves, and the yield on the 10-year Treasury dropped by 29 bp to 4.29% from year-end. In addition, credit spreads have begun to widen in investment grade bonds— following the significant move in high yield bonds, which are 35 bp wider month to date.1
Markets and businesses thrive on predictability, but they have been hit with a significant dose of uncertainty recently (Exhibit 1). Not knowing what to expect from economic policy has been associated with market volatility and historically has foreshadowed declines in investment, output, and employment.
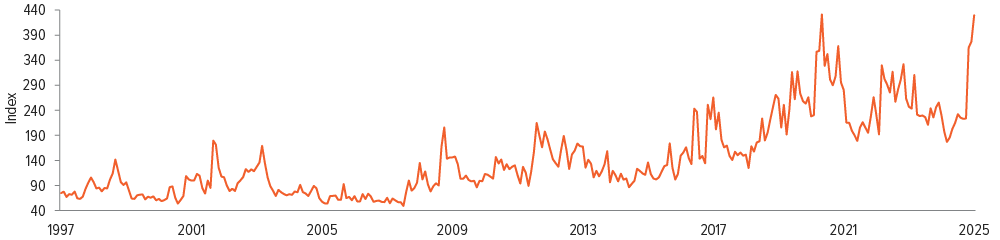
As of 01/31/25. Source: Scott R. Baker, Nick Bloom, Stephen J. Davis via FRED.
Several recent factors have contributed to the indecisiveness:
- Shifting tariff policies: Government policy around tariffs has been inconsistent, making it difficult to predict the economic impact on companies and consumers, and to understand the situation in the next six to 12 months.
- Weaker labor data: Last week, the unemployment rate increased from 4.0% to 4.1%. While this remains low relative to history, many anticipate a further rise due to federal worker layoffs while restrictive immigration policies could further disrupt the labor market balance.
- Slowing disinflation: Disinflation has slowed, and trade and immigration policies could reignite inflationary pressures.
- Fed rate cut uncertainty: The Fed has paused rate cuts due to strong economic data and above target inflation. However, softer recent data has increased the likelihood of a rate cut by the May meeting.
- Declining consumer sentiment: Consumer confidence fell sharply in February, reaching a 10-month high in pessimism about future employment prospects.
The combination of these factors is weighing on economic growth expectations. While growth is still expected to remain positive this year, the Atlanta Fed’s GDP tracker is forecasting a contraction in the U.S. economy for the first quarter, raising fears of a possible recession (though the odds are still below 30%) or 1970s-like stagflation (slow growth with high unemployment and high inflation).
Our view
Instead of getting caught up in the glaring headlines, stay anchored in key economic drivers. Here’s what we’re looking at:
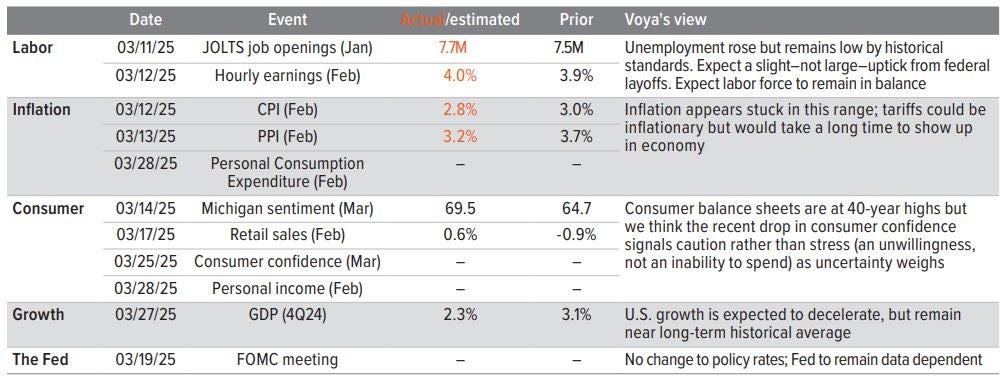
As of 03/13/25. Source: FactSet, Voya IM.
The consumer: The consumer remains the backbone of the U.S. economy, and their behavior will largely determine economic strength. Despite elevated uncertainty, which may make consumer spending more cautious, consumer debt levels relative to incomes remain low. This should help prevent a significant economic downturn.
Labor markets: Federal workforce cuts may unbalance the labor market, but total layoffs should be small relative to the overall size of the labor force. For context, the U.S. economy added nearly 600,000 jobs over the last three months.
Economic growth: If consumers rein in spending, economic growth will be impacted. We are expecting slower growth, but while the odds of a recession have increased, we do not anticipate one.
Monetary support: If we continue to see soft data, more aggressive cuts could be on the horizon. Currently, the market is pricing in two to three cuts—roughly 75 bp—compared to a small probability of a rate hike a few weeks ago.
Fiscal support: Tariff policies and a trade war, including retaliation from trading partners, will likely impede growth. While offsets such as deregulation, tax cuts, or other fiscal policies are expected, we believe growth will suffer before the benefits of these policies trickle through the economy.
Investment implications of heightened volatility
Fixed income: Positioned to take advantage of dislocations
None of the recent data materially impact our longer-term themes. We already expected the economy to slow, having just experienced several years of above trend growth, and have been positioned for volatility. Although we’re not anticipating a recession, we acknowledge that the risk has risen.
If market sentiment deteriorates further, we are poised to benefit from potential dislocations. For example, during last August’s dislocation in the high-yield market, we repositioned portfolios to benefit.
On the credit side, further volatility should lead to more attractive valuations, allowing us to close some of our underweight to corporate credit. Even in a slower growth, higher inflation environment, as long as the economy delivers positive real growth, the credit market should be okay.
The yield on the 10-year Treasury had retreated to mid-December levels, below the yield on election day. The softer data have pushed it even lower (Exhibit 3). We think yields could rally further but are currently within their fair value range.
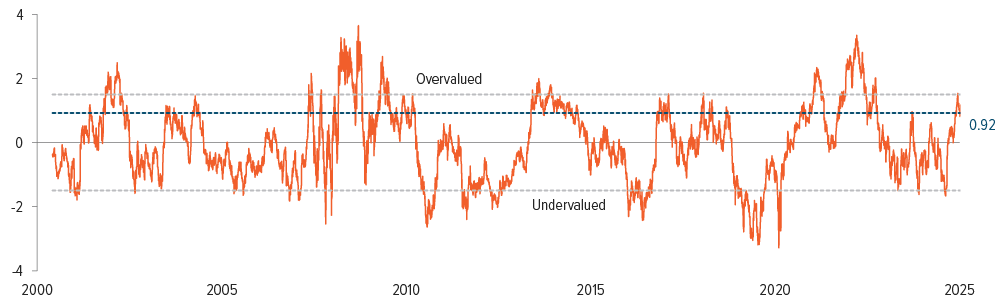
As of 02/14/25. Source: Chart shows the z-score for the 10-year U.S. Treasury deviation from fair value. Dashed lines indicate 1.5 standard deviation from mean.
How we are positioning fixed income portfoliosMulti-sector: We remain focused on the front end of the credit curve, avoiding longer spread duration assets, and we favor higher-quality assets. This leads to more liquidity without sacrificing carry and gives us the capacity to add risk should spreads widen further. Corporate credit: These sectors are more dependent on international trade, and with credit spreads already very tight, there is a strong bias for spreads to widen. We are currently underweight but will look to add as valuations become more attractive. Securitized credit: These securities— particularly those backed by domestically oriented assets such as U.S. commercial and residential real estate, and U.S. consumer credit—are more insulated from geopolitical issues such as trade disruptions. As a result, these sectors should hold up relatively well if broader market volatility persists. |
Equities: Individual company fundamentals drive value
The equity market is a sentiment indicator. While sentiment has declined, we believe U.S. large cap stocks look relatively attractive due to a better business investment environment, expected deregulation, and increasing merger and acquisition activity. Fourth quarter earnings were strong, with ten out of the 11 sectors posting positive returns, 17% earnings growth, and 5% revenue growth. We expect 2025 aggregate U.S. earnings to grow in the high single digits, aided by lower wage growth and driven by sectors beyond technology stocks.
U.S. equities could receive a further boost as the extension of the Tax Cuts and Jobs Act is clarified. This could further reduce individual and corporate tax rates, and extend bonus depreciation for capital investments and research costs. While the market is concerned about stretched valuations, which are high relative to historical levels, this doesn’t necessarily mean prices need to correct.
We believe that the changing composition of the S&P 500, with a growing technology sector and its capital-light business models, indicates that profit margins may have reached a new, higher equilibrium. This shift justifies current valuations and suggests that equity returns could align with earnings growth over the medium term (Exhibit 4).
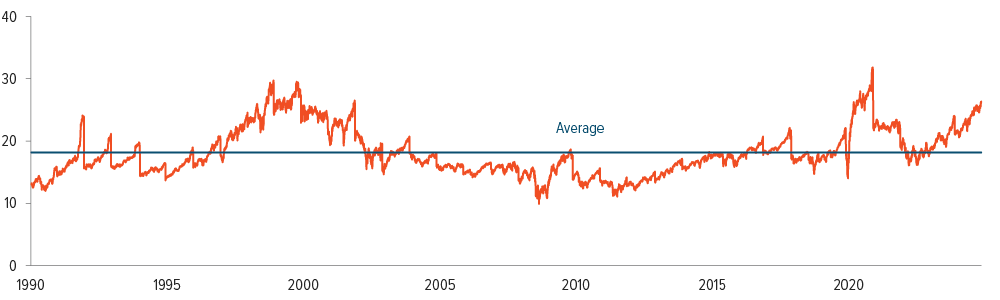
As of 02/13/25. Source: Bloomberg. Chart shows the S&P 500 next twelve months price-to-earnings ratio.
How we are positioning equity portfoliosWhile macroeconomic factors may affect industries and sectors as a whole, the impact varies significantly among individual companies. Our bottom-up, fundamental approach allows us to understand how macro factors may influence companies in our portfolios. Volatility may drive a lasting broadening of the market. In addition, the economics of artificial intelligence (how to monetize it and the scope of investment) are being called into question, further exacerbating the broadening trend away from the narrow market leadership of the last two years. This trend should benefit value overgrowth, small caps over large, and likely the rest of the world over the U.S. Stable value equities: In light of global trade policy, cyclical value stocks are relatively less attractive. We prefer stable value, characterized by inexpensive valuations with less volatile fundamentals. Small caps: Investors need to be aware of valuations, as we are seeing early signs of a rotation away from aggressive growth (momentum) stocks currently trading at peak valuations on peak earnings. However, we recognize there are many moving pieces and uncertainties, so making wholesale portfolio-level changes is not prudent. We continue to focus on company fundamentals for individual stock selection, while keeping an eye on trends that could influence positioning and future market leadership. |
Asset allocation: History preaches diversification
Year-to-date returns are negative for U.S. large caps, while U.S. investment grade bonds are positive.2 We think this negative correlation between stocks and bonds will persist, as it has historically, due to continued disinflation. This will help maintain the diversification benefit (Exhibit 5).
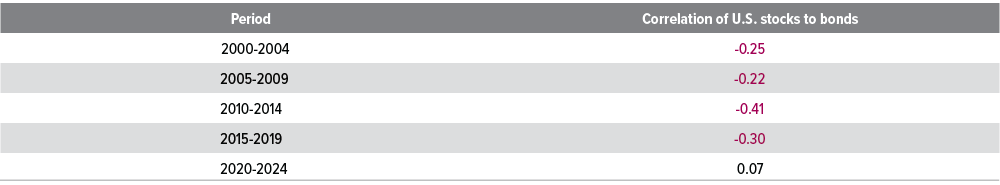
As of 12/31/24. Source: Voya IM. Data show the correlation between U.S. stocks (S&P 500) and U.S. bonds (Bloomberg U.S. Aggregate) for 5-year periods using daily data.