Senior Loan Talking Points

Managing Director, Head of Bank Loans and Global CLOs

Weekly Notables
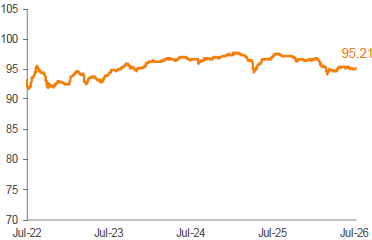
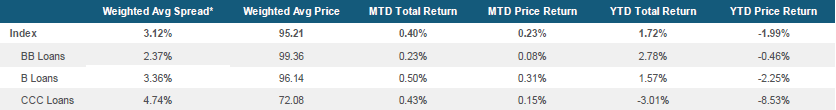
Economic data was light this week, although investors digested FOMC minutes, subdued jobless claims, and heightened geopolitical tensions. Oil prices rose 6% to around $72 per barrel after attacks on tankers near the Strait of Hormuz and President Trump’s statement that the U.S.-Iran ceasefire was “over.” While rates and equities were volatile in reaction to the headlines, credit spreads were largely unchanged. The U.S. loan market, as represented by the Morningstar LSTA U.S. Leveraged Loan Index, returned 0.25% for the seven-day period ending July 9, while the average Index bid price firmed to 95.21, representing a weekly increase of 13 basis points (bps).
Primary market loan activity rebounded sharply this week, with institutional volume nearing $11 billion. Opportunistic transactions remained a key theme, led by marine terminal operator Carrix’s$3 billion first-lien term loan, which will fund a shareholder distribution and refinance existing debt. Looking ahead, the forward pipeline remains subdued when stripping out expected repayments, as repayments now outstrip supply by $11.7 billion, compared to net repayments of $15.4 billion last week.
The secondary market strengthened this week, with lower-quality credits outperforming higher-quality loans. After lagging in June, the software sector has outperformed in July thus far, generating a MTD return of 1.16%.
Investor demand remained positive but modest overall. CLO managers priced four new deals this week, bringing YTD issuance to $83.9 billion, while U.S. retail loan funds recorded a small $47 million inflow for the week ending July 8, according to Morningstar. This follows the prior week's inflow of $220 million and marks the second consecutive weekly inflow.
There were no payment defaults in the Index this week.
Source: Pitchbook Data, Inc./LCD, Morningstar LSTA US Leveraged Loan Index. Additional footnotes and disclosures on back page. Past performance is no guarantee of future results. Investors cannot invest directly in the Index. *The Index’s average nominal spread calculation includes the benefit of base rate floors (where applicable).
Monthly Recap: June 2026
June was defined by a steady reduction in tail-risk concerns even as inflation and monetary policy moved back to the center of the market narrative. Negotiations involving Iran remained a key driver of sentiment. While headlines continued to ebb and flow, investors increasingly concluded that the worst-case outcomes were becoming less likely. As confidence in a negotiated path improved, energy markets retraced much of their earlier shock, with oil prices falling sharply from conflict-driven highs and ending the quarter near pre-war levels. At the same time, the economy continued to exhibit resilience. The May employment report surprised materially to the upside with 172,000 new jobs added, reinforcing the view that the labor market remained healthy despite slower growth earlier in the year. The May CPI report showed that headline inflation reached 4.2% year-over-year, while core inflation remained near 2.9%. Similarly, Core PCE inflation, the Federal Reserve’s preferred gauge, came in at 3.4% year-over-year, reinforcing the growing belief that inflation may remain closer to 3% than the Federal Reserve’s target for an extended period. June also marked a regime change at the Federal Reserve, as new Chairman Warsh used his first meeting and press conference to reaffirm the Fed’s commitment to a 2% inflation target while removing traditional forward guidance. Markets were left to determine the likely path of policy with less direct input from policymakers. Against this backdrop, interest rates remained elevated, though month-over-month moves were modest as markets balanced stronger economic data against falling oil prices and lingering growth concerns. Credit markets were similarly stable, with spreads remaining near historically tight levels, producing positive excess returns versus Treasuries, but largely through yield carry rather than spread compression.
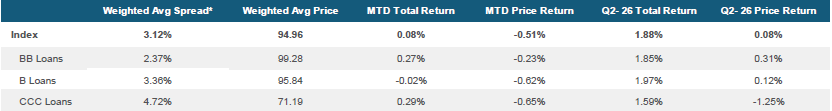
The U.S. loan market returned 0.08% in June, as secondary prices softened over the course of the month. The average Index bid price declined 37 bps to 94.96, reflecting elevated volatility across broader risk markets amid AI-related concerns, geopolitical uncertainty, and somewhat weaker loan technicals as CLO issuance moderated. Market conditions remained bifurcated, as investors continued to favor higher-quality credits and more defensive sectors, while reducing exposure to software and other segments perceived to be vulnerable to AI disruption. Software moved another leg lower in June, with the sector’s average bid price falling to an intra-year low of 85.86. Non-software performing loans were more stable, slipping just 14 bps during the month to 96.67. Given software’s significant representation within the broader Single-B cohort, this contributed to Single-B underperformance versus both BBs and CCCs.
Overall, technicals were softer in June than in the prior two months, as elevated new-issue supply coincided with a slower pace of CLO formation, leading to a supply surplus. For the month, arrangers launched about $40 billion of institutional loan issuance (ex-repricings), roughly in line with last month’s pace. YTD supply is now tracking approximately $215 billion, down 5% from the comparable pace in 2025. This month’s activity was a healthy mix of refinancings and M&A/LBO-related deals. Furthermore, dividend recaps saw an uptick this month at roughly 12% of total volume. Demand was lighter across the measurable investor segments. CLO issuance decreased to $10.3 billion in June compared to $16.8 billion in May. At roughly $80 billion, YTD issuance has been more muted compared to last year’s record-setting pace (down 20% year-over-year), primarily driven by April’s issuance lull and a weaker overall monthly issuance rate. US retail loan funds experienced modest outflows for the month at approximately $227 million, while YTD outflows have amounted to $5.9 billion.
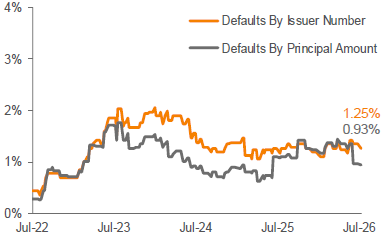
The LTM traditional payment default rate by amount outstanding declined sharply in June, falling to 0.97%, from 1.35% in May, as there were no payment defaults experienced during the month. Furthermore, there were no liability-management exercises (LMEs) recorded either. As a result, Pitchbook’s dual-rate tracker declined to 2.77% for the month, down from 3.11% in May.
Source: Pitchbook Data, Inc./LCD, Morningstar LSTA Leveraged Loan Index. Additional footnotes and disclosures on back page. Past performance is no guarantee of future results. Investors cannot invest directly in the Index. *The Index’s average nominal spread calculation includes the benefit of base rate floors (where applicable).