
Get the latest insights from our securitized credit desk.
It has rained for a week straight, humidity has the air heavy and temps are hot. All those are indicators that summer is here in Atlanta, but the reduced intensity of activity in our markets – especially around the ‘wings’ of the week (Mon and Fri) – is the stronger tell for us as we toil away on our trading floor.
My observations:
- The macro backdrop has been net-friendly for risk-taking in securitized markets since our mid-April note.
- The mid-May surge in rate-vol wasn’t pleasant, as it ate into hard-earned total returns and tempered our structural de-leveraging outlook. However, it has relented into month-end and stopped well short of returning to the 2023 highs (10yr closed at 4.99 on 10/19/23).
- AI displacement risk, which we previously called out as having the most feedback loops into securitized markets (CLOs in particular), hasn’t gone away, but it has been much less impactful in risk pricing. It has also fostered some changes in portfolio management strategies by CLO managers, which are likely good for sustainable long-term performance.
- Woes in private credit markets similarly haven’t gone away but have relented in this beneficial part of the redemption cycle for private credit funds.
- Likewise, we have not seen fallout in public securitized markets from these operators’ struggles. In fact, anecdotes of adjacent markets (CRE in particular) being allocated into, from direct lending have come across our radar.
- While we’d prefer less in the way of inflation pressures, we continue to judge US economic growth drivers as in-tact and net supportive of risk-taking.
- Fed policy continues to be the exception given budding inflation concerns, as well as the change in leadership, which has fed through into the afore referenced rate volatility.
- In addition to the impact on total returns (sad) and bond yields (happy), it has also tempered our expectations for transaction de-leveraging (the concept of loan pre-payments paying down senior bonds and reducing leverage for the benefit of subordinate bonds).
- Fed policy continues to be the exception given budding inflation concerns, as well as the change in leadership, which has fed through into the afore referenced rate volatility.
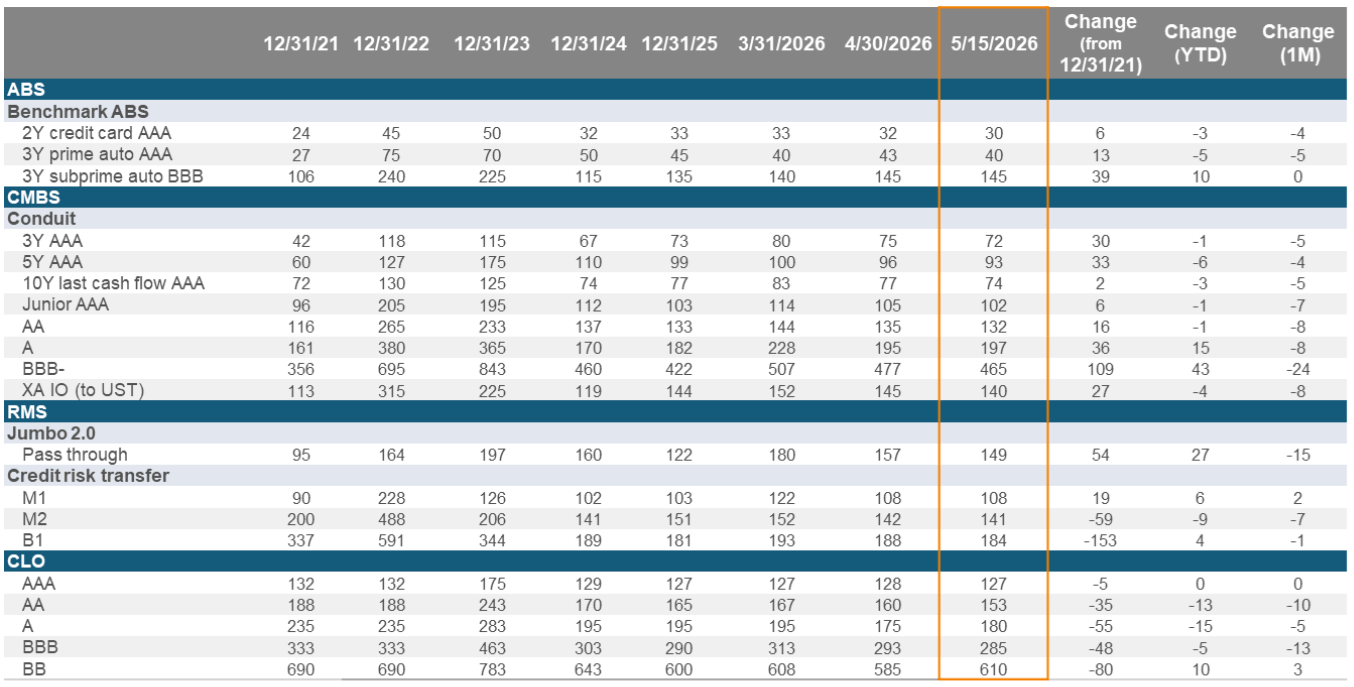
Source: Voya Investment Management, JP Morgan, Bank of America, Bloomberg. As of 5/15/2026.
- Not sure how the magnitude of these moves strikes you, but we characterize the moves in securitized as comprehensive (all sectors benefiting) and meaningful, although lagging the impressive move in equity markets.
- This contrasts with how we calibrated moves last month, when tightening was more moderate and uneven across sectors: while overall volatility of spread moves was reassuringly low, and liquidity was more than ample, the risk appetite wasn’t as hearty as what we have observed since.
- Indeed, sectors that exhibited more volatility in the more treacherous March time frame, and lagged in the April rebound, largely caught up in May.
- BB CLOs, BBB- conduit CMBS and higher coupon MBS have led our markets in recent weeks. This mostly reflects, in our estimation, the risk-on backdrop that has prevailed in markets, pushing traditionally higher beta trades to outperform.
- In general, credit curves have flattened with subordinates outperforming seniors and other dimensions of risk (issuer tiering, vintage tiering as examples) have re-compressed as clear indicators of renewed risk appetite.
- N.A. RMBS remains the least correlated sector by our eye and is refreshingly actionable: heavy issuance continues to promote the highest degree of net new issuance (gross issuance less paydowns) across securitized sectors at $39B (source: JPM). Risks remain well insulated and support for supply in non-securitized form has proven relentless – also good for spreads in this sector.
- CMBS has more definitively caught up in May, as new issuance has participated more fully in the risk-on move. Recall, March weakness was new issue-centric, with more seasoned parts of the universe enduring less measurable spread widening. In May, this dynamic has been largely erased, with more eager risk appetite being expressed in new issue markets by investors.
- Also recall, we were buyers ahead of this move and called out our April ‘Love Like Leave’ piece where this was one of several trades highlighted into Q2. May’s update offers a more tempered ‘Like’ assessment.
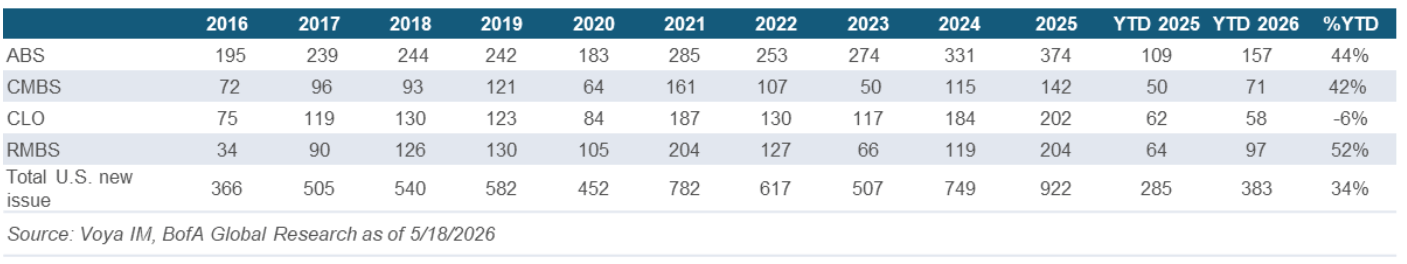
Securitized Credit Issuance
As we progress further into the quarter, the more measured pace of issuance in securitized products has become increasingly apparent. Outside of the afore-mentioned pick-up in non-agency RMBS issuance, volumes across ABS, CLOs and CMBS have been lower in Q2 on a year-year basis, a decided retreat from the record pace we were on after Q1. If you recall, we characterized April issuance as on the moderate side, despite pipelines (known deals but not formally announced in the markets) that were significant. While these have ultimately been delivered, they were slower to be deployed than in Q1. We attribute this primarily to the rate backdrop, as issuers seemed to strategize deal timing around periods of elevate rate vol during the month. While the pick-up in rates has moderated, we expect that originations of new collateral has likely declined given the overall sustained move higher in rates and re-pricing of Fed policy rates.
Outlook
- While the set-up is less favorable than the beginning of Q2, we remain positive on securitized credit into June. The run-up in equities and corps should continue to feed through to securitized, and the expected flare-ups in Iran will continue to show securitized markets as less sensitive with limited direct feedback loops.
- However, the month does present some looming challenges for our markets: 1) the Fed will meet for the first time under its new Chair Warsh (circle June 17th), and uncertainty around balance sheet policy (see agency MBS) in particular will have our keen focus; and 2) the Q2 cycle for private credit fund redemptions will hit full swing, so we will watch for potential feedback loops as capital flows continue to evolve there.
- Lastly, summer seasonals are now on us, with reduced liquidity on Mondays and Fridays and a likely slower overall pace of new issuance, the key implications for market participants.
We hope everyone is able to enjoy the beginning of summer and look forward to updating you on things as we wrap Q2 and an eventful 1H of the year.
Voya Securitized Team