Fixed Income Perspectives: As Equities Rattle, Bonds Quietly Adjust

Chief Investment Officer

As stocks react to the chaotic tariff rollout and deteriorating confidence, bonds are quietly adjusting to a slower-growth outlook. It’s a direction we’ve prepared for in our fixed income portfolios.
Expectations revised, but a downturn isn’t inevitable
Market hopes for a pro-growth policy push have rapidly given way to concerns that the administration’s aggressive tariff posture and spending cuts could thrust the economy into recession. Broad U.S. stock indexes have given up all their gains since the election. Bond markets are telling a similar story: 10- year Treasury yields have rallied, driven by a decline in real yields, while credit spreads have widened from extremely tight levels.
While this is far from the fixed income flight to quality that we’d expect from an imminent economic downturn, the market is adjusting to an economic “air pocket”: Small business and consumer sentiment have declined, unemployment has ticked up, and consumer spending has disappointed. On the other hand, inflation has continued to fall, and, despite slightly higher unemployment, the labor market has remained stable, with lower initial claims and increasing job openings.
While recession signs are not currently visible, the early risk of stagflation—higher unemployment, slower growth, and elevated inflation—has blossomed. However, we still expect U.S. GDP of around 2% in 2025. (The Fed lowered its median estimate to 1.7% in its March projection.1 ) Meanwhile, inflation, while remaining stubbornly above the target range, has cooled significantly. Both consumer and corporate balance sheets remain strong, minimizing the risk that a slowdown could lead to a more impactful default cycle.
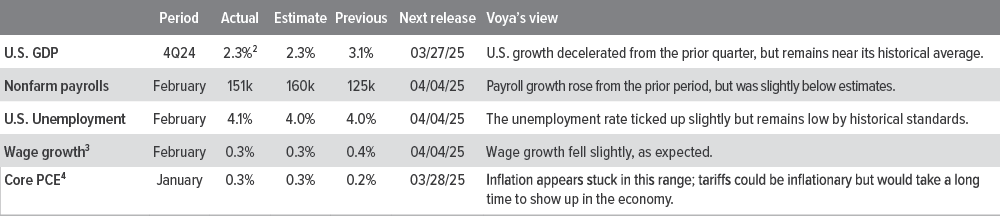
As of 03/17/25. Source: Bloomberg, Factset, Voya IM.
The Federal Reserve’s summary of economic projections this week supports the “revision, not recession” story. Although the Fed kept rates unchanged this week, the dot plot suggests two rate cuts later this year. This should support bond performance even as spreads widen further.
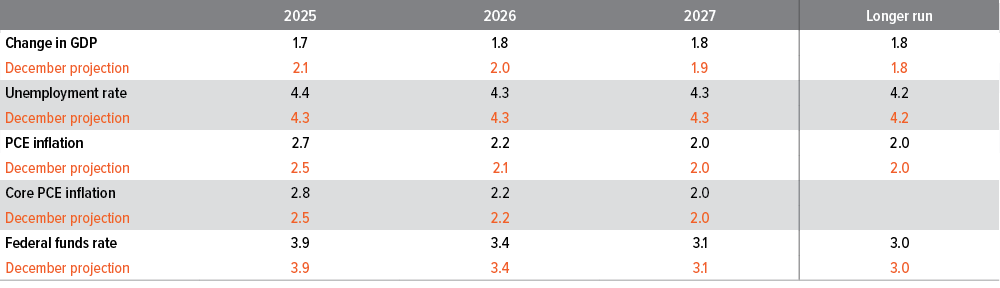
As of 03/19/25. Source: Federal Reserve Summary of Economic Projections. Data show the median (middle) projection in percent. For other notes on the projections, visit federalreserve.gov.
Positioning for softer growth
None of the recent data meaningfully change our longer-term themes. We already expected the economy to slow, as it has experienced several years of above-trend growth, and we have been positioned for volatility. Although we’re not anticipating a recession, we acknowledge that the risk has risen.
If market sentiment deteriorates further, we are poised to benefit from potential dislocations. For example, during last August’s dislocation in the high yield market, we repositioned portfolios to benefit.
On the credit side, further volatility should lead to more attractive valuations, allowing us to close some of our underweight to corporate credit. Even in a slower-growth, higher-inflation environment, as long as the economy delivers positive real growth, the credit market should be okay.
- Multi-sector: We remain focused on the front end of the credit curve, avoiding longer-spread-duration assets, and we favor higher-quality assets. This leads to more liquidity without sacrificing carry and gives us the capacity to add risk should spreads widen further.
- Corporate credit: These sectors are more dependent on international trade; as such, spreads have widened as tensions have escalated. However, with credit spreads still very tight, there is a strong bias for spreads to widen further. We remain underweight but will look to add as valuations become more attractive.
- Securitized credit: These securities—particularly those backed by domestically oriented assets such as U.S. commercial and residential real estate, and U.S. consumer credit—are more insulated from geopolitical issues such as trade disruptions. As a result, these sectors should continue to hold up relatively well if broader market volatility persists.
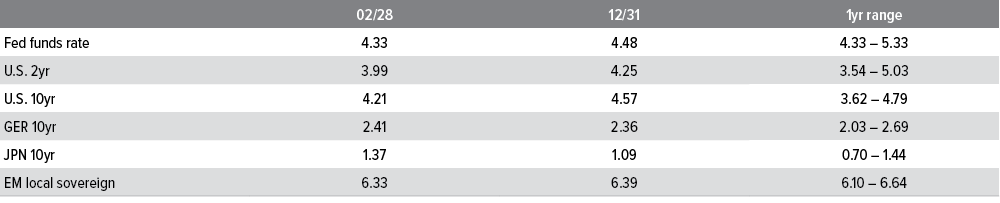
As of 02/28/25. Sources: Bloomberg, JP Morgan, Voya IM. See disclosures for more information about indices. Past performance is no guarantee of future results.
Sector outlooks

Investment grade corporates

- IG fundamentals remain solid overall but the macro outlook has become less supportive for IG spreads.
- Uncertain fiscal policy will continue to drive volatility, but overall technicals and yield still provide some support.
- Credit spreads have widened YTD but still appear expensive.
High yield corporates

- High yield returns were solid in February but failed to keep pace with the rally in Treasuries. Wider spreads make the high yield market modestly more attractive.
- We’ve added small positions to take advantage of wider spreads and elevated volatility but we continue to wait for a better entry point to increase exposure more meaningfully.
- From a positioning standpoint, we are overweight food/beverage and healthcare/pharma, and we are underweight technology, as well as media/ telecom companies with structurally challenged business models.
Agency mortgages

- MBS market weight strategically, currently flat to benchmark.
- Security selection provides more opportunity than sector beta management.
- Valuations are still cheap versus history. However, agency passthroughs have tightened dramatically and now look less attractive relative to other sectors.
Senior loans

- Return on the loan market was notably softer this month. Coupon carry remained a key driver of performance and CCCs outperformed. Investor demand remained strong although new institutional issuance was low.
- A positive macro environment, easing monetary policy, and supportive technicals are expected to sustain demand for leveraged credit. However, stronger net supply, fueled by a rebound in M&A activity, may soften the supply/demand imbalance.
- While corporate fundamentals should improve as rates decline and earnings growth rebounds, the market remains bifurcated, emphasizing the importance of careful credit selection.
Securitized credit
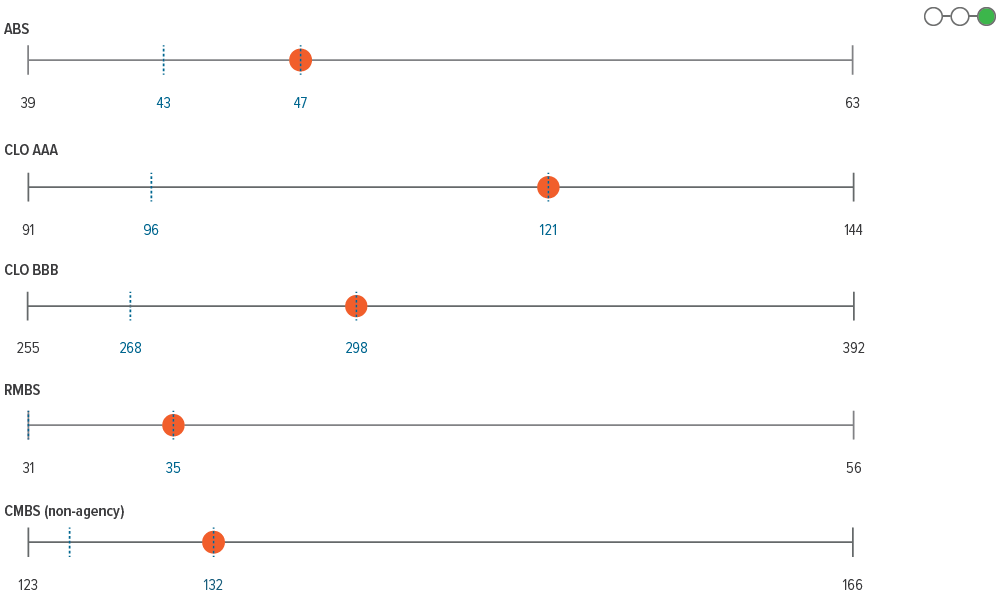
- Consumer balance sheets and lower overall LTVs should continue to support fundamentals.
- Positive seasonals and solid fundamentals in consumer ABS are offset by spreads that hover at multi-year tights and credit curves that remain compressed into the initial stages of higher volatility catalyzed by potential trade wars.
- CMBS remains supported by the rally in financial conditions, which have retraced back to levels last seen in 2021. This is evident in the open nature of the CMBS primary market, as well as more liquid and active risk taking in secondary markets.
- Our outlook for CLOs remains positive, but has weakened month over month given weakening survey and consumption data, paced by policy announcements and sequencing.
Emerging market debt

- The growth outlook for emerging markets is modest, with risk skewed to the downside given risk of higher U.S. tariffs.
- Absolute yield levels remain attractive relative to historical levels despite the recent rally.
- Issuance is expected to slow sequentially in March but will likely remain robust.
A note about risk
The principal risks are generally those attributable to bond investing. All investments in bonds are subject to market risks as well as issuer, credit, prepayment, extension, and other risks. The value of an investment is not guaranteed and will fluctuate. Market risk is the risk that securities may decline in value due to factors affecting the securities markets or particular industries. Bonds have fixed principal and return if held to maturity but may fluctuate in the interim. Generally, when interest rates rise, bond prices fall. Bonds with longer maturities tend to be more sensitive to changes in interest rates. Issuer risk is the risk that the value of a security may decline for reasons specific to the issuer, such as changes in its financial condition.