In Q3 2023, US CLO debt tranches delivered strong returns across the stack driven by increasing carry and uptick in prices.
CLOs – 3Q Review
- In Q3 2023, US CLO debt tranches delivered strong returns across the stack driven by increasing carry and uptick in prices. These returns registered 2.53%, 3.2%, 4.33%, 6.19%,7.58% and 9.04% for AAA, AA, A, BBB, BB and B rating cohorts, respectively. On a YTD basis, returns are tracking 6.36%, 8.05%, 10.17%, 12.43%, 16.02% and 17.28%, respectively.
- Q3 was another strong quarterly performance for the CLO market. Successful LIBOR to SOFR transition was a key highlight with most of the US CLOs fully transitioned. Spreads were tighter and Q3 new issuance was strong at $29 billion alongside a return of reset activity. As base rates continue to increase, all-in coupon looks compelling with attractive yields and relative value compared to other fixed income asset classes. While loan default activity and rating downgrade activity decelerated from Q2, overall credit metrics were slightly weaker. Technicals are expected to remain supportive in the medium term given the manageable issuance pipeline, a reflection of a challenged arbitrage environment.
- Direction of spreads and any potential tightening going forward will be influenced by various developments including new issue supply, relative value versus other structured/corporate products, renewed AAA demand from the large US banks, continued support from Japanese investors, National Association of Insurance Commissioners (NAIC) rulings on capital charges for below investment-grade tranches, deterioration in macro and spread decompression in credit.
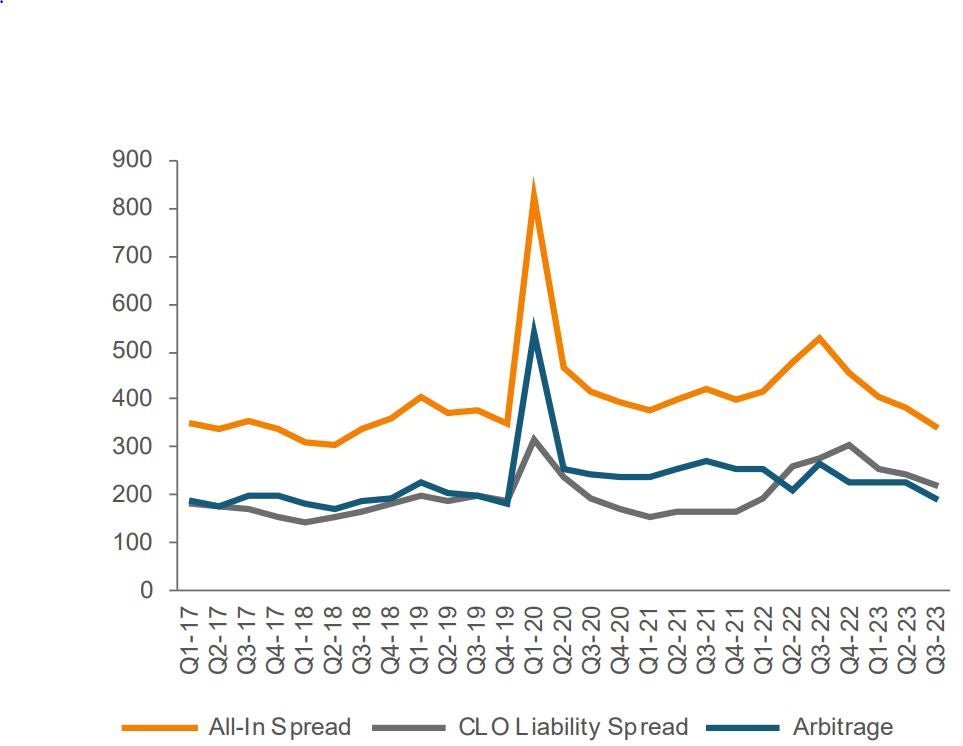
- A challenging arbitrage environment continues to be a key driver behind lower issuance versus last year. Arrangers have resorted to creative structures and deal economics to facilitate deal syndication. Large manager absence remains a notable theme versus prior years. As per Deutsche Bank CLO research, the top 20 CLO managers (which account for 45% of total US CLO market), have seen 50% decline in issuance in 2023 with respective volumes tracking $25 billion (vs. $49 billion last year). As per Citibank research, despite the current presence of 170 US CLO managers today, 76 US CLO managers (about 40%) did not issue in 2023 and 39 US managers haven't issued since 2020, (half of which are small managers with less than $2 billion CLO AUM). Potential for further US CLO manager consolidation remains topical with at least 6 managers sold or acquired YTD.
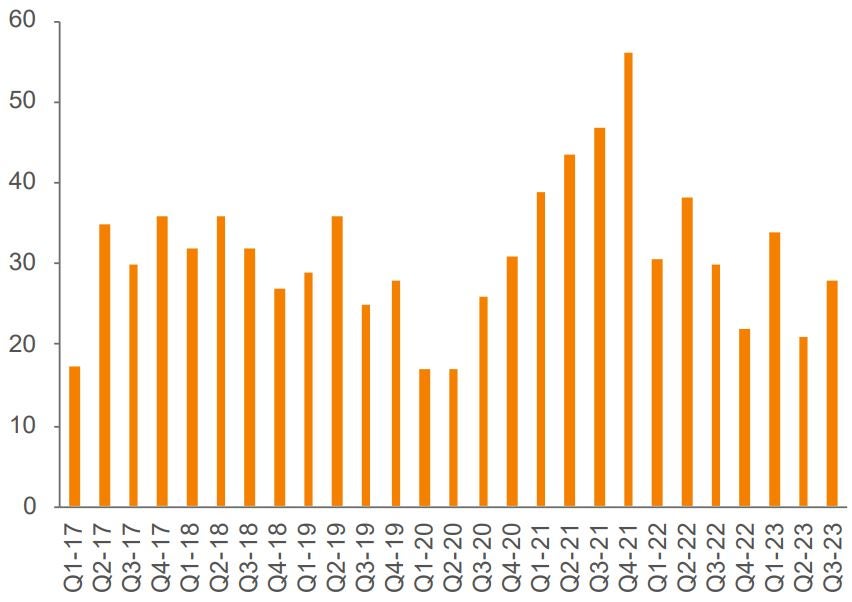
U.S. CLO Issuance ($ Billions)
January 1, 2018 to September 30, 2023
U.S. CLO Arbitrage at Issuance (Bps)
January 1, 2018 to September 30, 2023
U.S. CLO BWIC ($ Billions)
January 1, 2018 to September 30, 2023
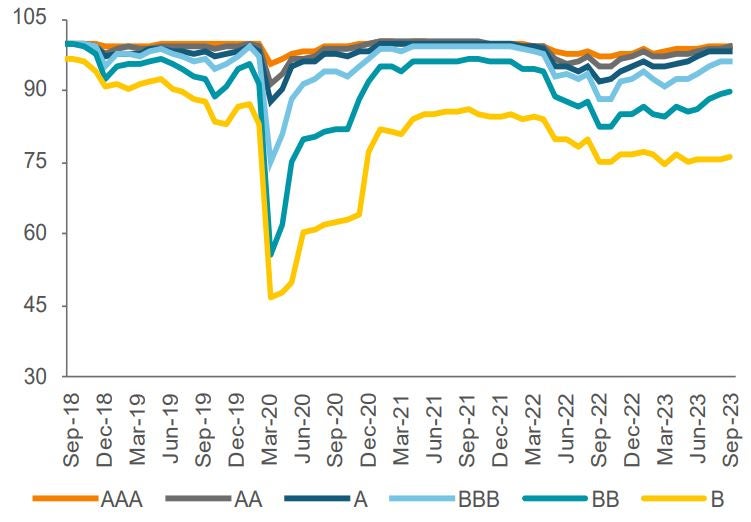
Sources: LCD, BofA Global Research, Ratings refer to original rating, and spreads are generic. Actual spreads may differ based on structure, WAL, collateral and manager.
- CLO equity distributions remained strong in Q3, like Q2, after a strong rebound from Q1. On an annualized basis, as per Barclay’s research, US BSL median equity distributions are tracking 17.1%, a level last seen in 2016. The favorable equity distribution is driven by rising rates (with asset payments catching up with the liability stack), stabilization in 1M/3M LIBOR/SOFR basis offsetting the effects of a minor increase in liability yields due to 0.26% credit spread adjustment (CSA) inclusion.
- Despite continued stability in market value and credit metrics across portfolios, a dispersion trend is developing as more CLO portfolios exit reinvestment periods. Thus far, 30% of deals are post reinvestment and another 15% is slated to exit in a year or less. Different manager approaches to portfolio management (managing stressed/distressed credits and ability to navigate liability management transactions) will likely result in additional dispersion.
- As of Q3 2023, based on JP Morgan market estimates, 99.9% of the floating-rate US CLO debt market (about $873 billion in market size) is priced to 3M Term SOFR. In CLO portfolios, 76.3% of loan exposures in CLOs are priced to SOFR, which compares to roughly 78.1% for JPM’s Leveraged Loan Index. CLO portfolios have exposure to various benchmarks with the largest base rates being as follows: 1M Libor (1.6%), 3M Libor (4.9%), 1M Term SOFR (59.3%), 3M Term SOFR (30.7%), 6M Libor (0.3%) and 6M Term SOFR (1%).
- Looking ahead, we continue to focus selectively on primary and newer vintage reset opportunities. As we have been lately, we remain biased towards defensive positioning via exposure to larger managers with clean portfolios. Relative value looks attractive vs. other comparable asset classes The current yield on offer across the CLO Mezz tranche universe is very attractive. Returns are benefiting from slight price appreciation coupled with increasing coupons. While spreads have generally grinded tighter in Q3, we’re cautious about some potential widening if rates volatility increase, macro environment weakens, loan fundamentals eventually crack and geopolitical risk intensifies. With such a backdrop, we’re more constructive on BBBs with current yields in the high single digits. As for BBs, with double digit yields, we’re very selective and prefer deals with stronger subordination and defensive portfolios.
U.S. CLO 2.0/3.0 Secondary Spreads (Bps)
January 1, 2018 to September 30, 2023
U.S. CLO Tranche Average Price
September 1, 2018 to September 30, 2023
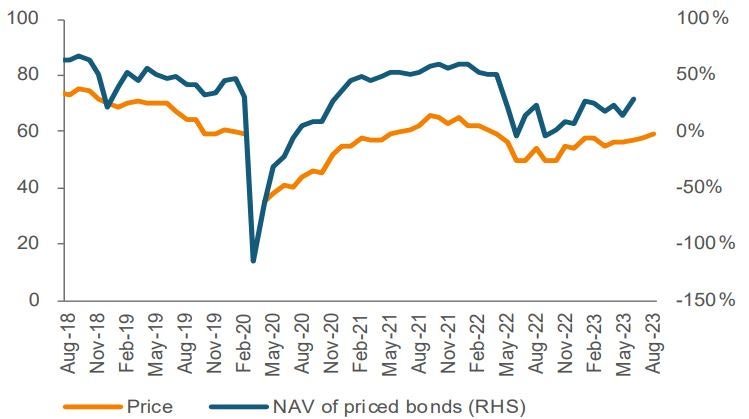
Equity Price and NAV
August 1, 2018 to August 30, 2023
Pricing Across The CLO Stack
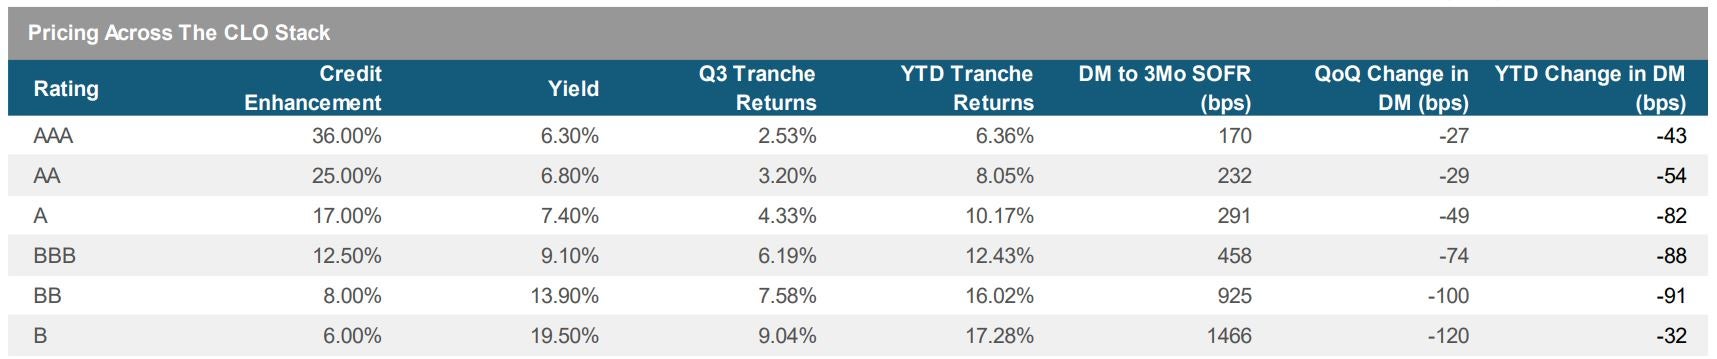
Sources: BofA Global Research, Morgan Stanley Research, and J.P. Morgan.
Leveraged Loans – 2Q Review
- The third quarter of 2023 contained an abundance of strong data, as the prospect of a soft landing gained credibility. Inflation continued to trend in the right direction, as Core PCE, which at its peak was running at a YoY rate of 5.6%, fell to 3.8% by the end of August. Meanwhile, the economy continued to add jobs at a fast pace. The combination of falling inflation and a strong labor market allowed consumers to continue spending, creating a tailwind for GDP growth. Maintaining a data dependent stance, the Fed responded to this better-than-expected data by hiking rates at their July meeting. In September, the Fed kept rates unchanged, however their updated dot plot projection reinforced a “higher for longer” message. This led to a broad sell-off across rates, leading to disappointing returns across both fixed income and equities. Despite the weaker tone in risk assets, loans continued to remain resilient.
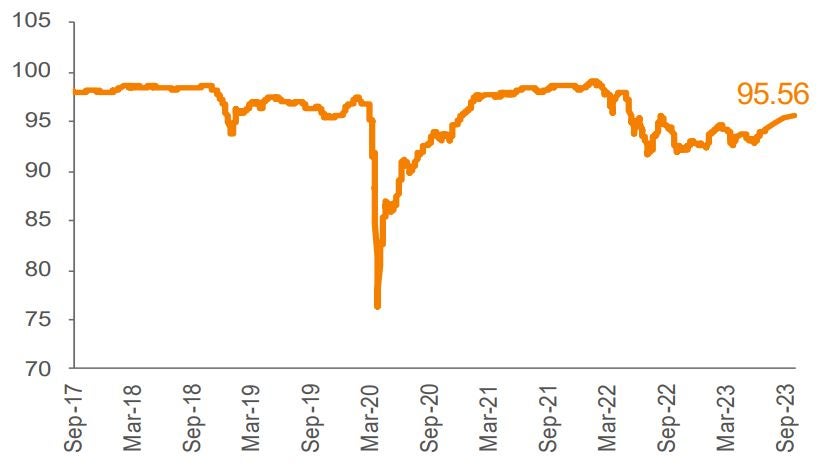
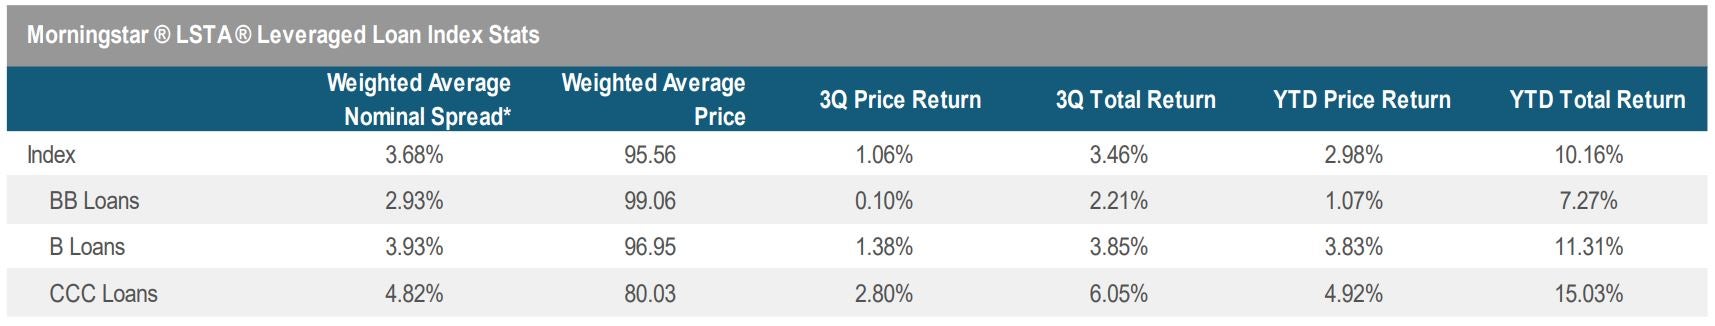
- The Morningstar® LSTA ® US Leveraged Loan Index returned 3.46% during the quarter (the highest quarter return since Q4 2020). Rising coupons, driven by an increase in base rates and stable nominal spreads, continue to be a large contributor to positive returns alongside a slow uptick in price appreciation. The average bid price moved higher by 132 bp, closing out September at 95.56. On a YTD basis, the index returned 10.16% (the strongest return since Global Financial Crisis).
- The secondary market was strong over the course of the quarter despite some choppiness occurred towards the end of September. Lower-rated names continued to outperform their higher quality counterparts. For context, CCCs, Bs and BBs posted gains of 6.05%, 3.85%, and 2.21% respectively. On a YTD basis, lower-rated names have outperformed with returns for BBs, Bs, and CCCs coming in at 7.27%, 11.31%, and 15.03%, respectively.
- Unlike Q2, issuance in the primary market picked up this quarter. Total supply currently tracking $76.3 billion marking the highest issuance since early 2022 when the Fed started their rate hikes. Nonetheless, YTD figures remain fairly compressed at just $179 billion, which is roughly in line with the subdued pace set last year for the comparable YTD period ($189 billion).
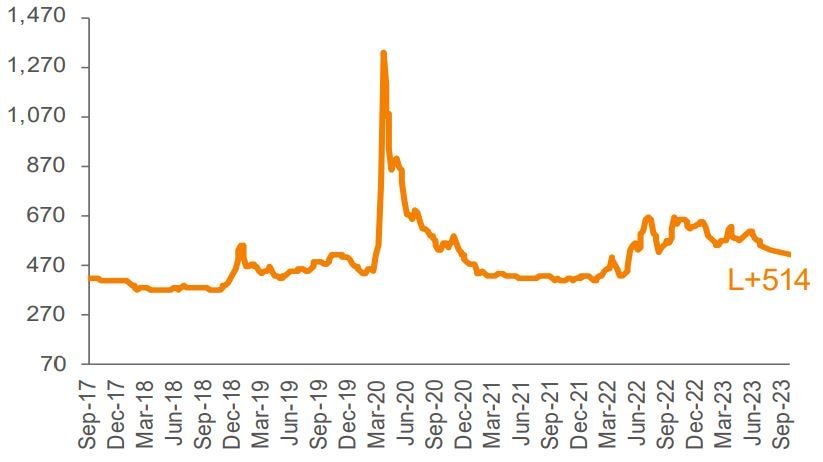
Average Bid: Morningstar LSTA LLI
September 1, 2017 to September 30, 2023
Average 3-YR Call Secondary Spreads: Morningstar LSTA LLI 2,3
September 1, 2017 to September 30, 2023
Loan Issuance and Repricing Activity ($ Billions)
January 1, 2021 to September 30, 2023
Source: LCD, The Morningstar ® LSTA ® Leveraged Loan Index. Past performance is no guarantee of future results. Investors cannot invest directly in the Index. *The Index’s average nominal spread calculation includes the benefit of LIBOR floors (where applicable).
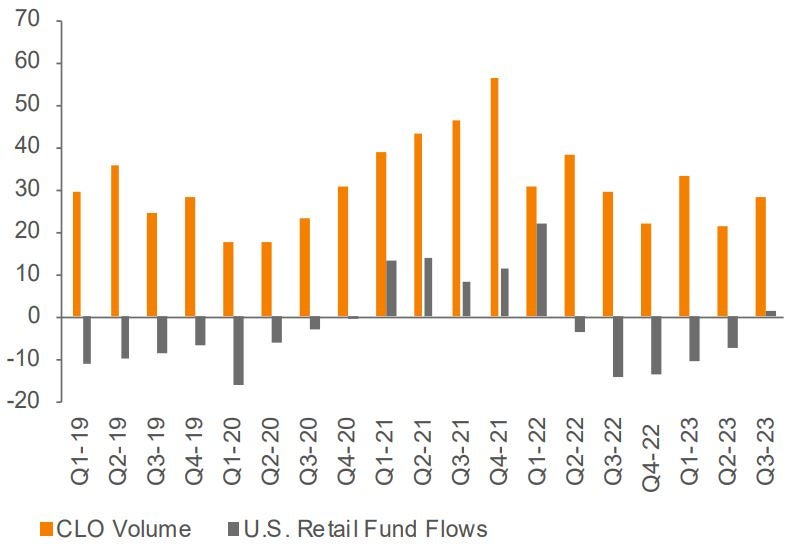
- On the investor front, CLO issuance increased in Q3, as liability spreads tightened throughout the debt stack, creating opportunities for issuance. The total volume grew to $28 billion from $22.4 billion last quarter but down 15.7% from last year’s level of $33.2 billion. Meanwhile, YTD Q3 2023 saw 197 new issuance deal, 7 refinancing and 17 resets, totaling $85.5 billion, $2.7 billion and $7.1 billion, respectively. New issue volumes are down 20% year-over-year (versus $106 billion in Q3 2022). Refis and resets are down 30% and 65%, respectively.
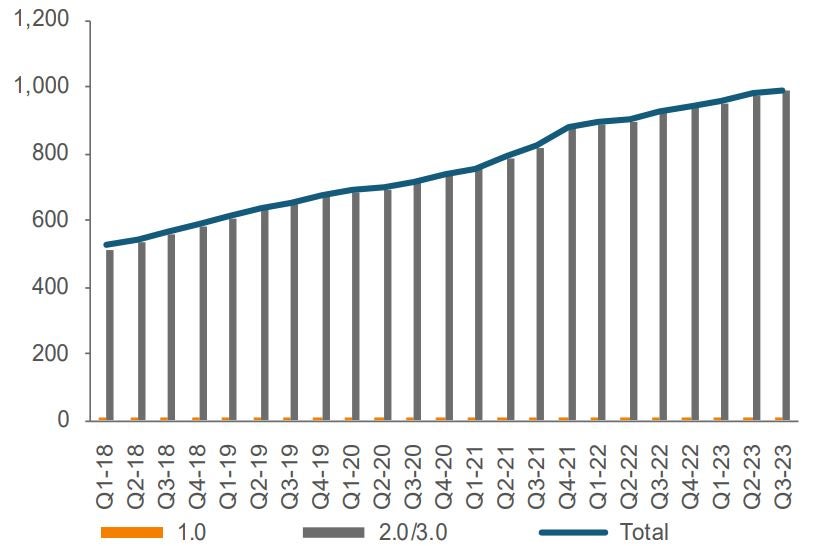
- The global CLO market surpassed $1 trillion in 2021 and will likely reach $1.2 trillion sometime in 2023. Continued solid formation in Q3 further increased the size of the US CLO market, which currently stands above $989 billion as of the first quarter, equating to more than a 100% increase from the start of 2017.
- While retail outflow activity decelerated in Q3, retail loan funds reported the first positive quarter with an inflow of $1.04 billion since Q1 2022. YTD outflows have amounted to approximately $16.3 billion.
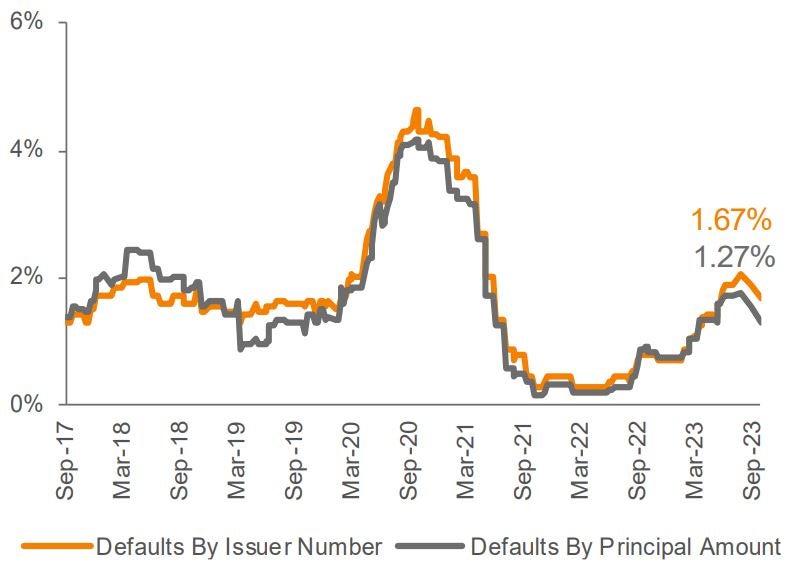
- Default activity moderated in Q3 compared to last quarter. There were four defaults in the Index during the quarter as the trailing 12-month default rate by principal amount moved lower to 1.27%, from 1.71% in June (remains well below historical average). Although defaults have picked up recently from historically low levels, we expect the trailing rate to remain below long-term averages, at least in 2023,
- The ratio of downgrades to upgrades decreased in Q3, with the rolling 3-month downgrade-to-upgrade ratio increasing to 1.73x (from 2.37x in 2Q23). Key downgrade themes include earnings, margin pressure, elevated leverage levels, increased borrowing costs and 2021 vintage loans not achieving realized synergies.
- Looking ahead, we expect macro-related volatility to remain a prominent theme in the near term, as the “higher-for-longer” rates backdrop and uncertain path to lower inflation will continue to influence market sentiment. While the US economic outlook has been favorable and appears to have de coupled from the rest of the world, policy rates remain highly restrictive in the medium term and there are risks that consumer spending eventually weakens as the built-up excess savings from the pandemic diminish, credit conditions tighten further, and student loan repayments resume. The Fed is expected to remain firmly data-dependent and hold a hawkish bias until there is high conviction that inflation is firmly under control. Supported by healthy technicals and a historically high level of interest carry, performance in the loan market has been resilient despite some increased volatility in other asset classes.
U.S. CLO Market Size ($ Billions)
January 1, 2018 to September 30, 2023
CLO Volume and Retail Fund Flows ($ Billions)
January 1, 2019 to September 30, 2023
Lagging 12M Default Rate: Morningstar LSTA LLI (4)
September 1, 2017 to September 30, 2023
Source: BofA Global Research, LCD, Morningstar ® LSTA ® Leveraged Loan Index.