
Oleg Gershkovich, A.S.A., M.A.A.A.
LDI Solutions Strategist

Brett Cornwell, CFA
Client Portfolio Manager, Fixed Income
Funded status improved once again for S&P 500 pension plans, rising for the fourth consecutive quarter to 108.7%—the highest level since 2007.
Notes on the quarter
- Funded status improved once again for U.S. pension plans, rising for the fourth consecutive quarter to 108.7%—the highest level since 2007.
- The curve bear steepened, with the 10yr UST and 30yr UST increasing 75 bp and 86 bp, respectively, on the quarter.
- Credit spreads narrowed, driving a 73 bp net increase in the discount rate. For a plan with a duration of 12, an 8% decrease in liability translates to a 9.3% improvement in funded status.
- Assets declined for S&P 500 pension plans, resulting in a -7.8% change in funded status, detracting from the gains made on liabilities.
In the spotlight: Less investment grade corporate bond issuance. Strong demand for IG long-duration credit from pension plans, coupled with declining new issue volumes as companies spurned high borrowing costs, put downward pressure on long-dated yields. In 3Q, 61% of new issuance had a tenor under 10 years easily the highest level over the past decade), while issuance with tenors above 20 years fell to a decade low, accounting for only 12% of new issuance. (See corporate issuance chart below.)
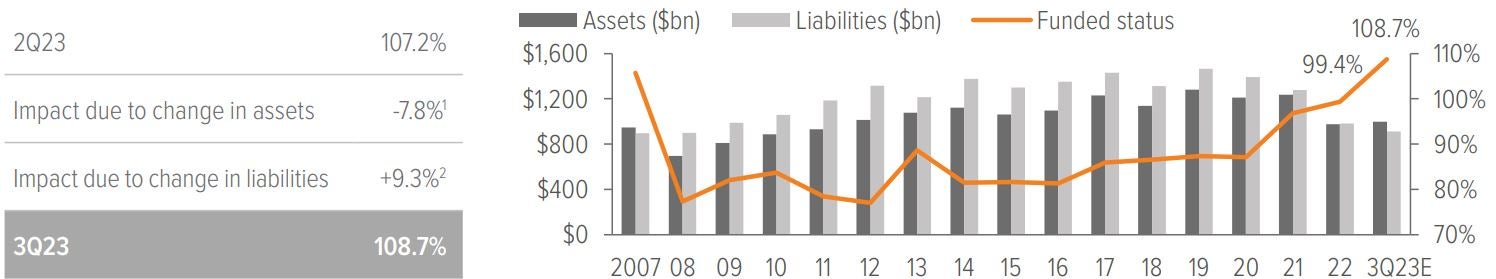
As of 09/30/23. Source: S&P, company reports, Voya IM calculations and 2023 estimates. 1 Growth assets based on S&P 500 return of -3.3%; hedging assets (which match liability duration) had a 7.9% loss, similar to liabilities, by design, also reflecting benefit payments. 2 Liabilities declined 7.9% due to 73 bp increase in rates and plan duration of 12 years, plus service accruals and benefits payments.
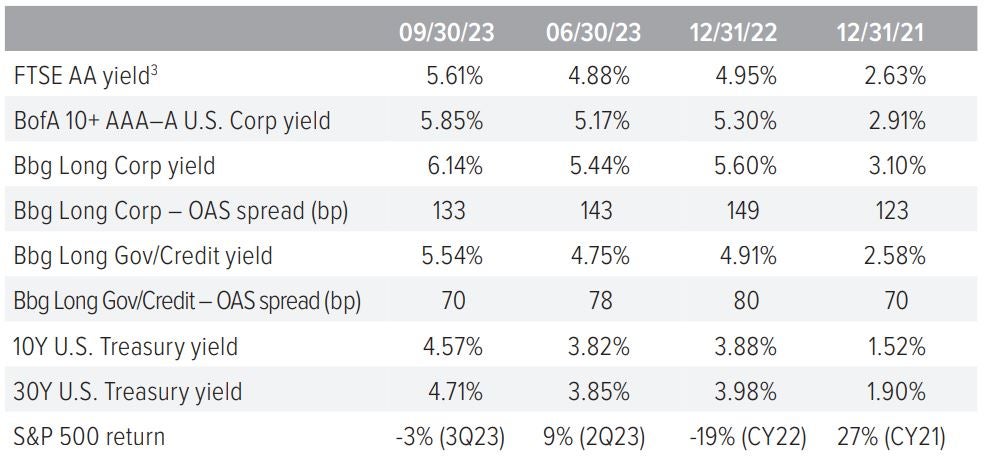
Source: FTSE, Barclays Live, ICE Index Platform, S&P.
3 Based on FTSE’s “short” duration plan, approximately 11 years.
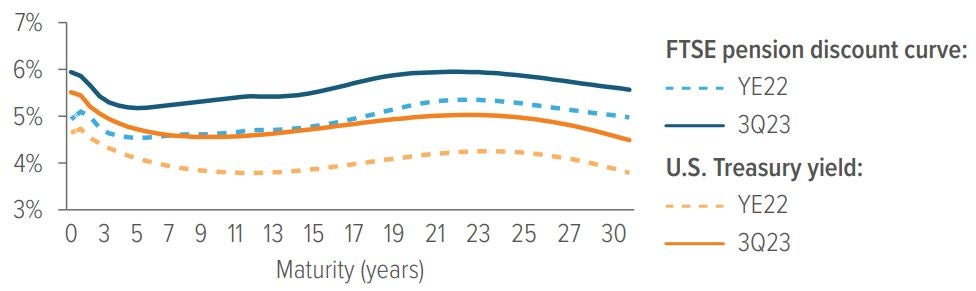
Source: ICE Index Platform, FTSE pension discount curve.
- The U.S. Treasury spot rate curve is flatter than the FTSE pension discount curve as of 09/30/23.
- For the 15-year tenor, the UST spot rate is higher as of 09/30/23 versus 12/31/22.
- Similarly, for the 15-year tenor, the AA rated corporate bond spot rate is higher as of 09/30/23 versus 12/31/22.
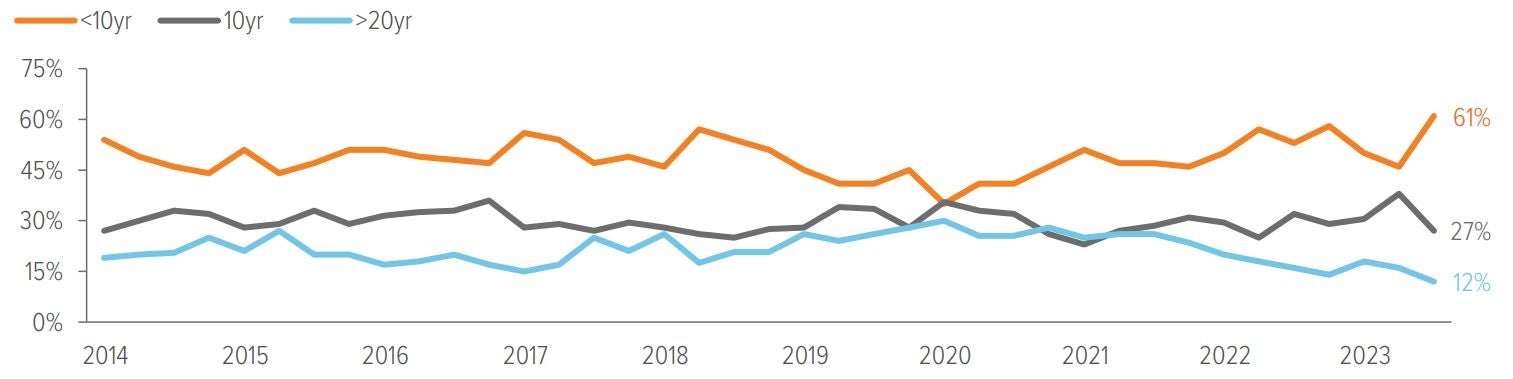
As of 09/30/23. Source: Goldman Sachs.
A note about risk Examples of LDI (liability-driven investing) performance included in this material are for illustrative purposes only. Liability valuations can increase due to falling interest rates or credit spreads, among other things, as the present value of future obligations increases with falling rates and falling spreads. Liabilities can also increase due to actual demographic experience differing from expected future experience assumed by the plan’s actuary. Diversification neither assures nor guarantees better absolute performance or relative performance versus a pension plan’s liabilities. In addition, investing in alternative investment products such as derivatives can increase the risk and volatility in an investment portfolio. Because investing involves risk to principal, positive results and the achievement of an investor’s goals are not guaranteed. There are no assurances that any investment strategy will be profitable on an absolute basis or relative to the pension plan’s liabilities. Information contained herein should not be construed as comprehensive investment advice. For comprehensive investment advice, please consult a financial professional. |